
Navigating a system during verification
What you're looking at
When you open a system inside an engagement, you enter the review environment. This is where the client's system lives — the system boundary, processes, emission sources, activity data, and the products whose carbon footprint is being verified.
The environment is read-only from your perspective. You cannot edit the client's system. Your work here is to inspect it, check it against the applicable requirements, and record findings where something needs clarification or correction.
What you're reviewing is a registered snapshot. The client locked their system before requesting verification. What you see is the version they submitted — immutable until a new verification round begins.
Navigation dropdowns
The toolbar at the top of the review environment has two lists that let you navigate the scope of your review.
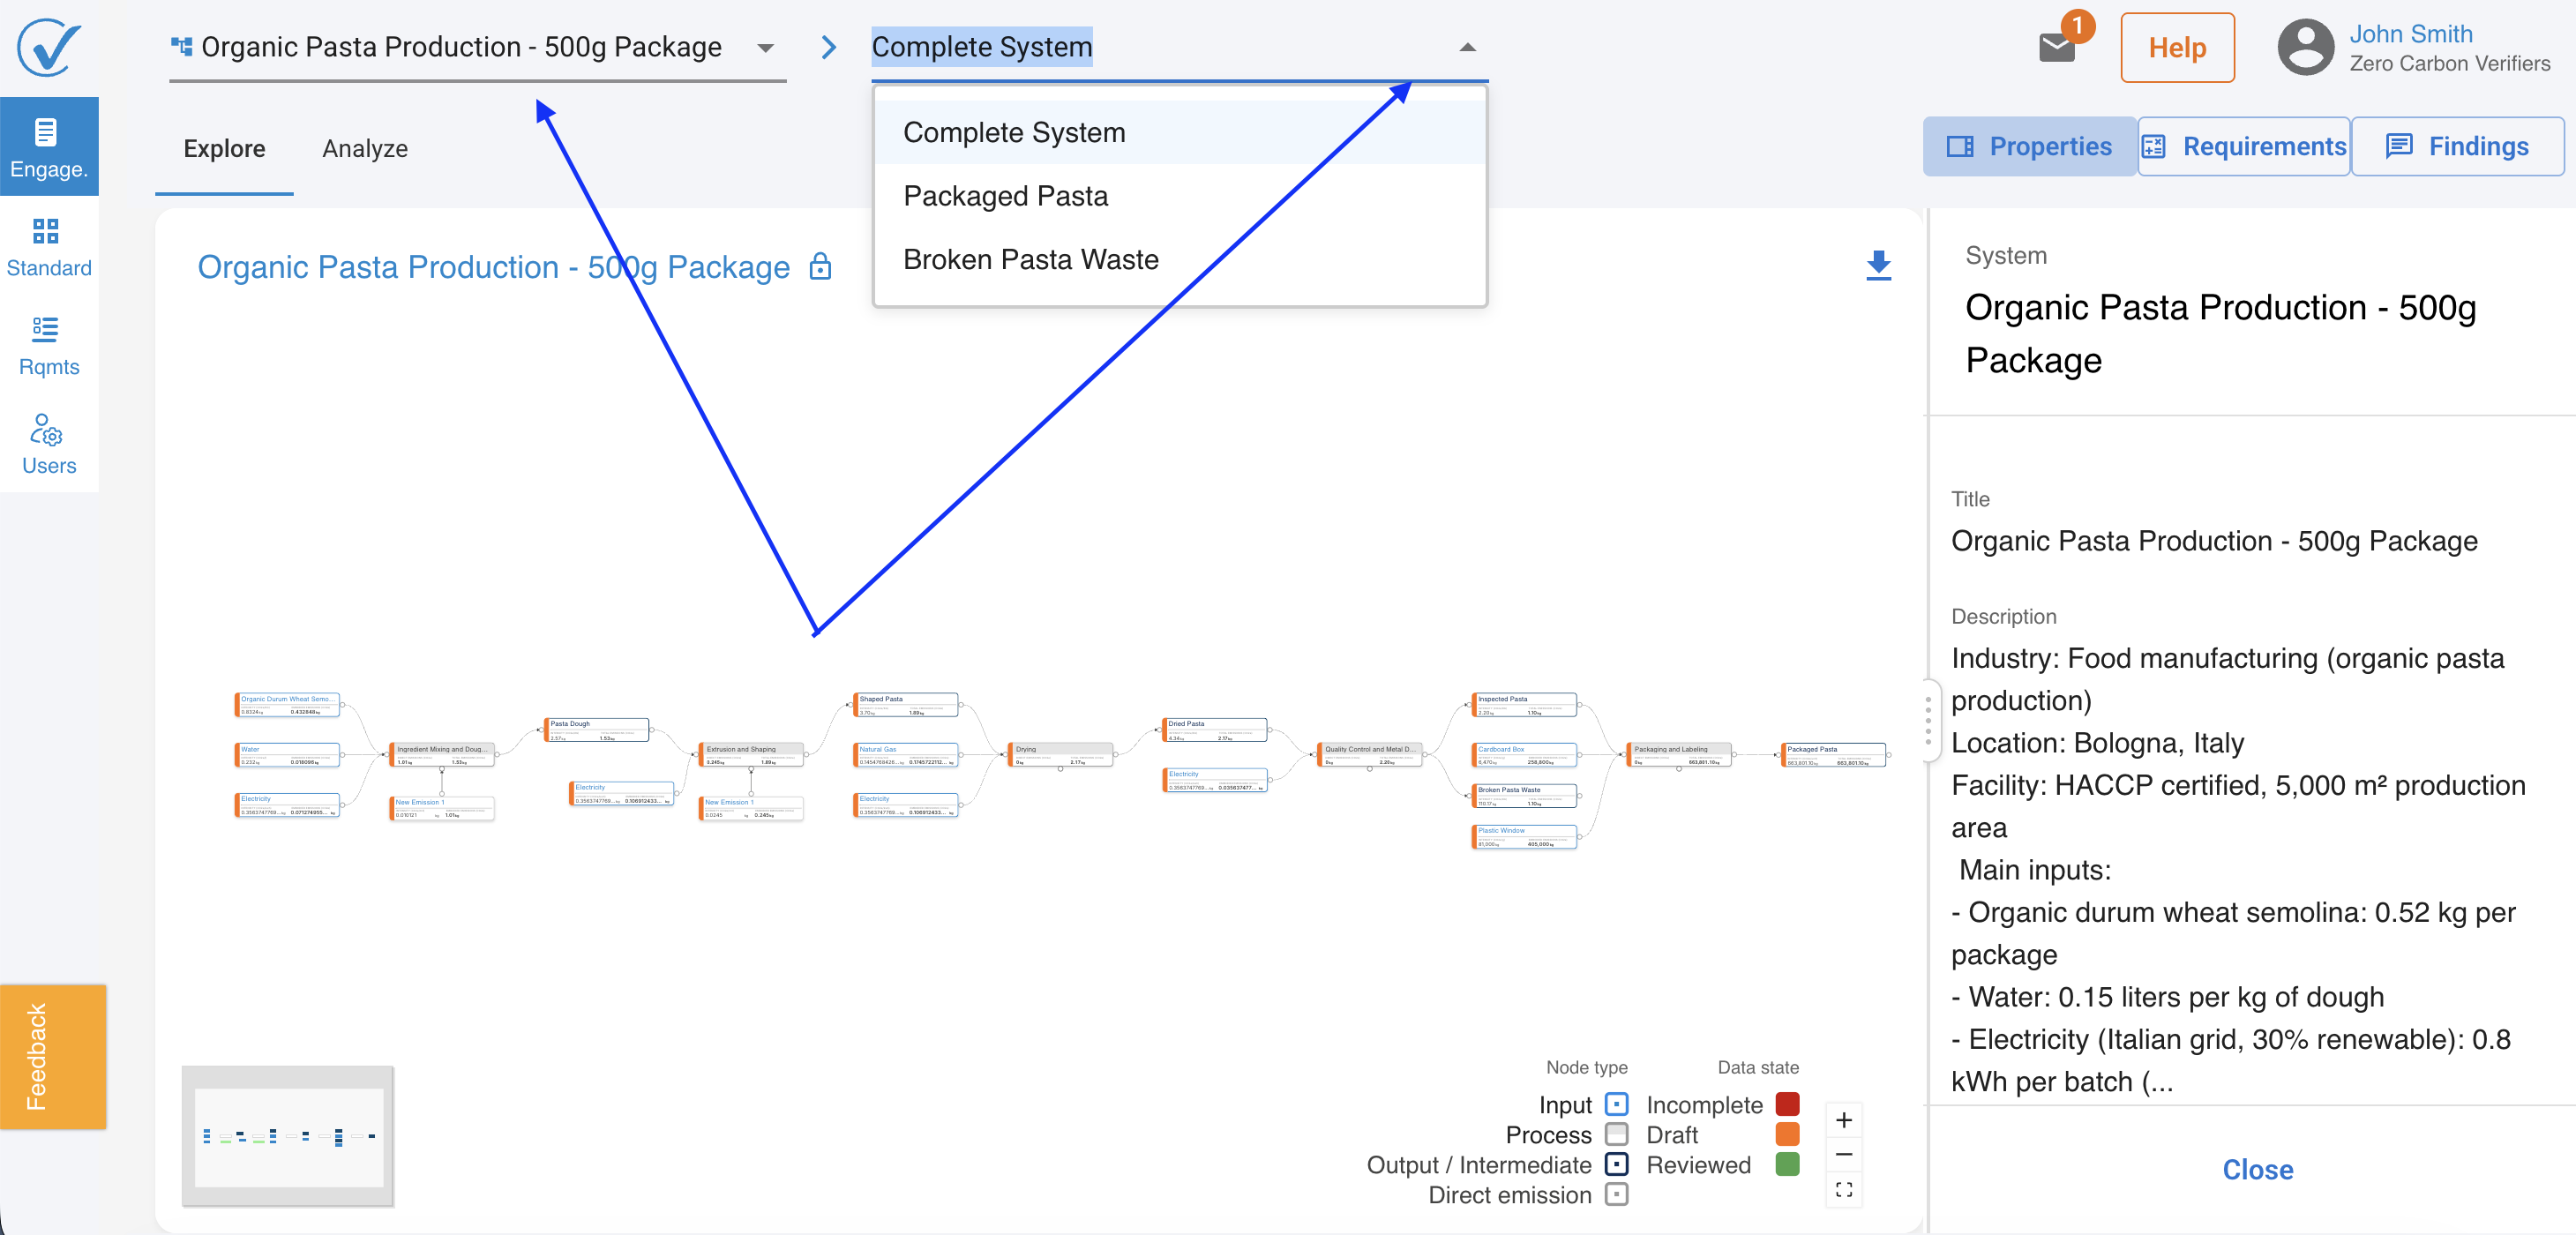
First dropdown listing every system included in this engagement. Many engagements cover more than one system — for example, a manufacturer may have submitted both a raw material system and a finished product system. Switching systems updates the entire view: the canvas, the panes, and the requirements all reflect the selected system.
Second dropdown listing every product included in the selected system in the first dropdown.
View controls
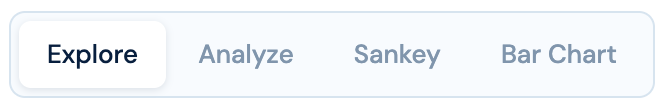
To the right of the system selector are four view options:
Tip: The right-hand panes (Properties, Requirements, Findings) are persistent across all views. You can raise or review findings without leaving the current canvas view.
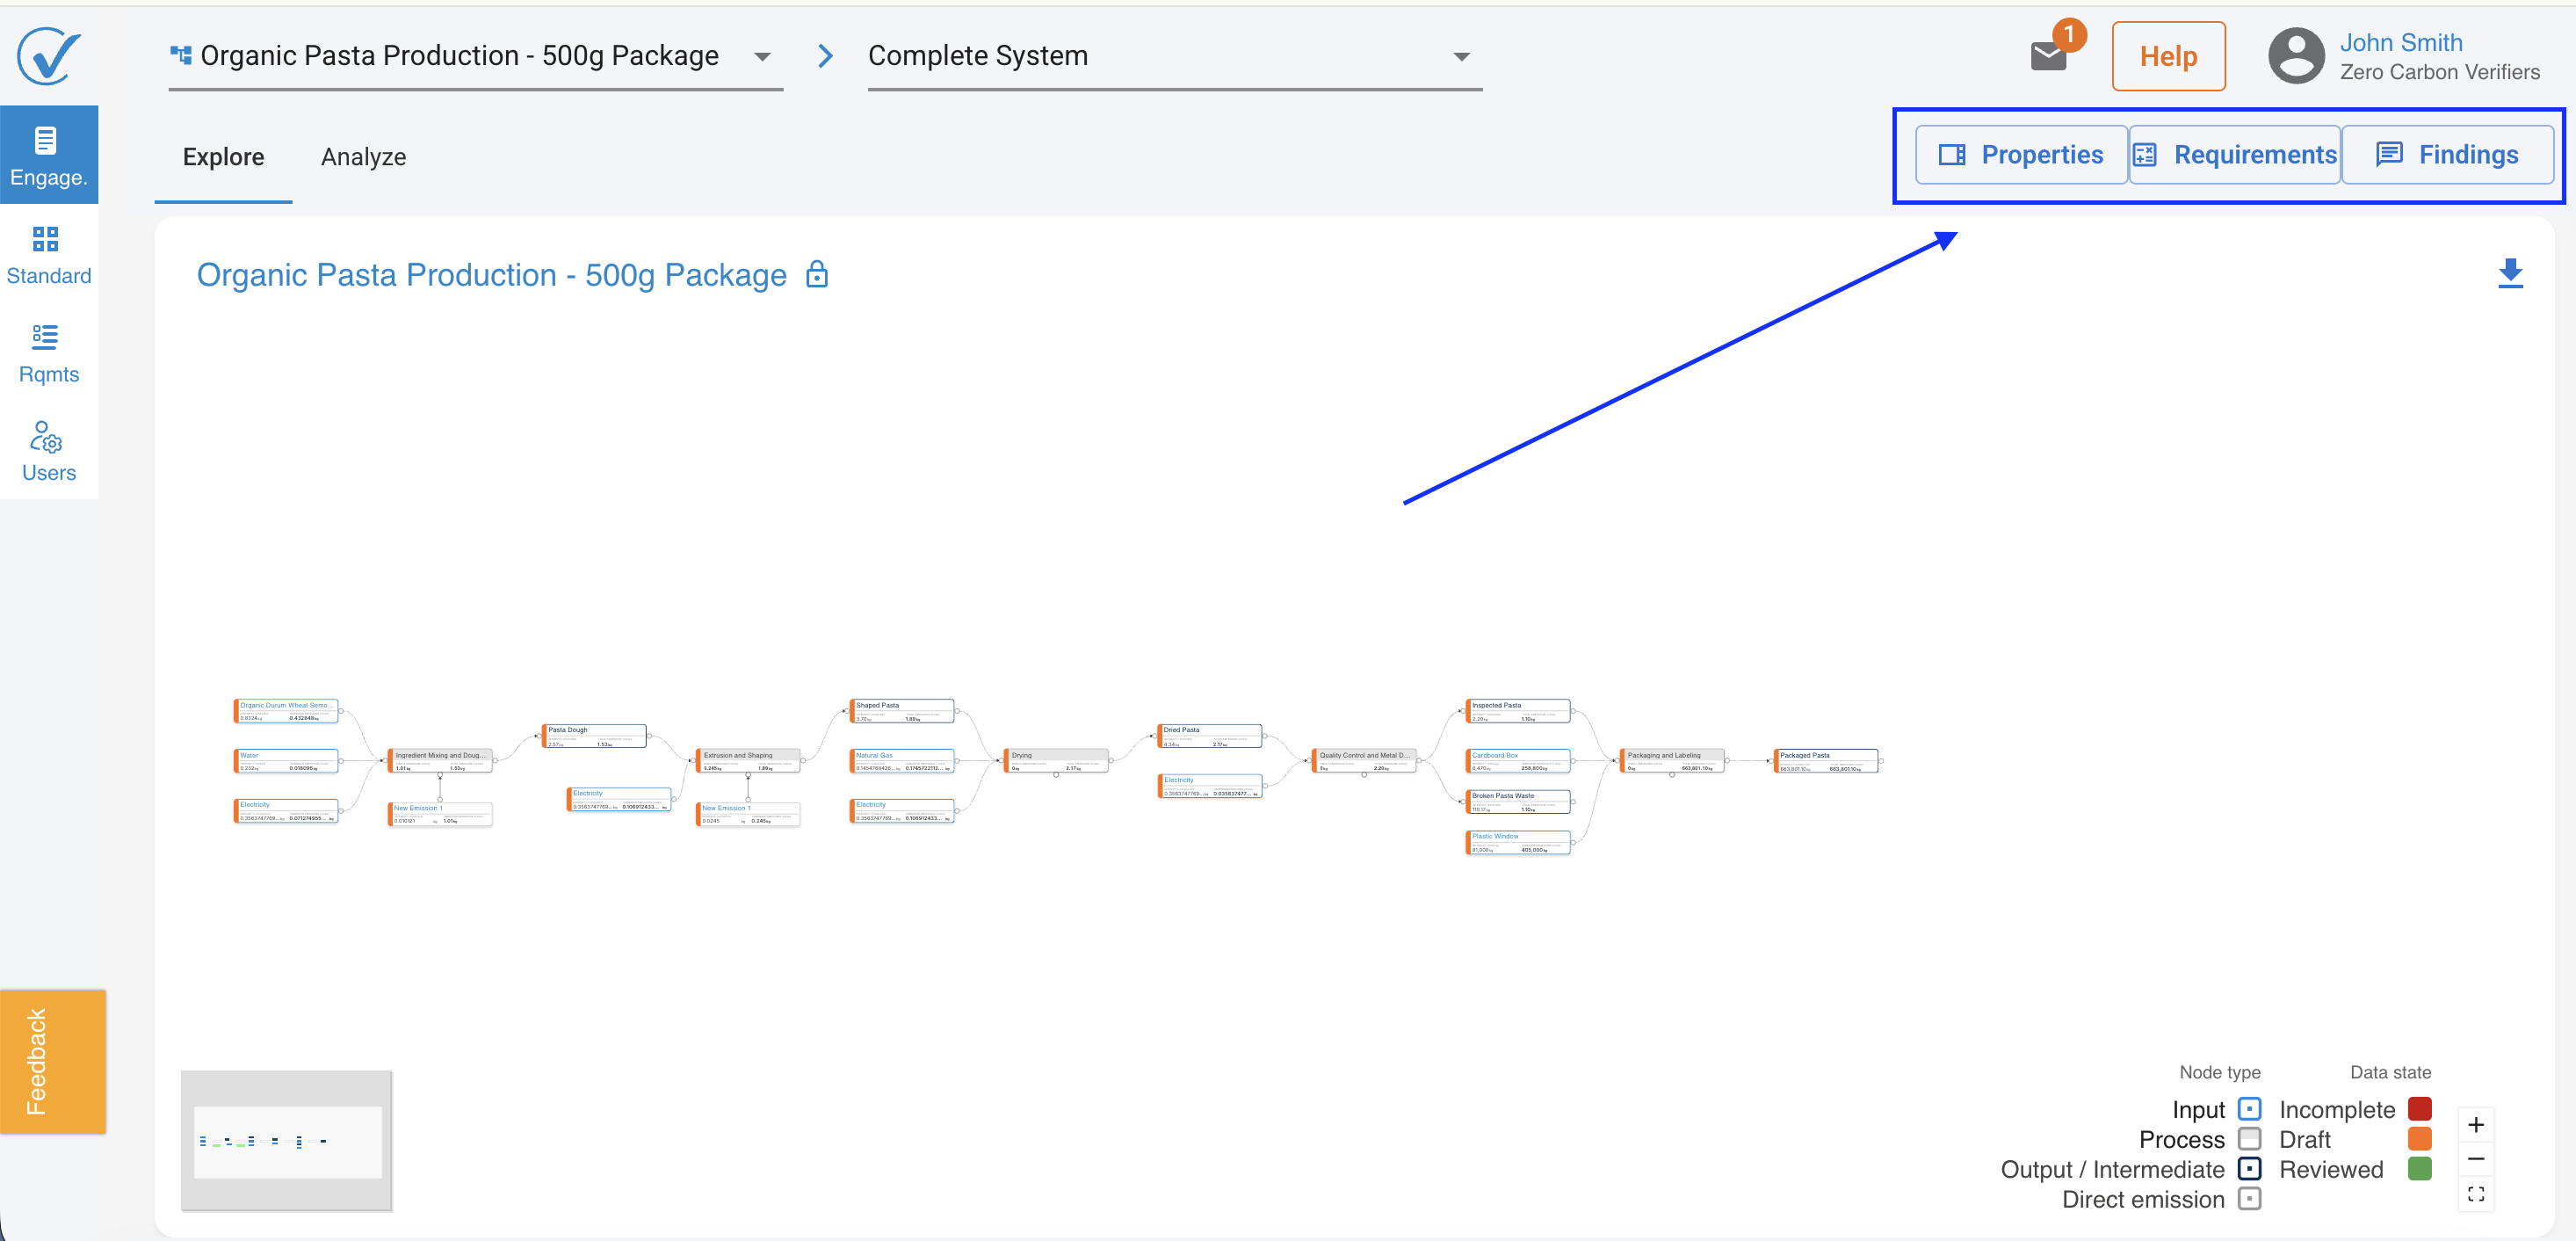
Explore view
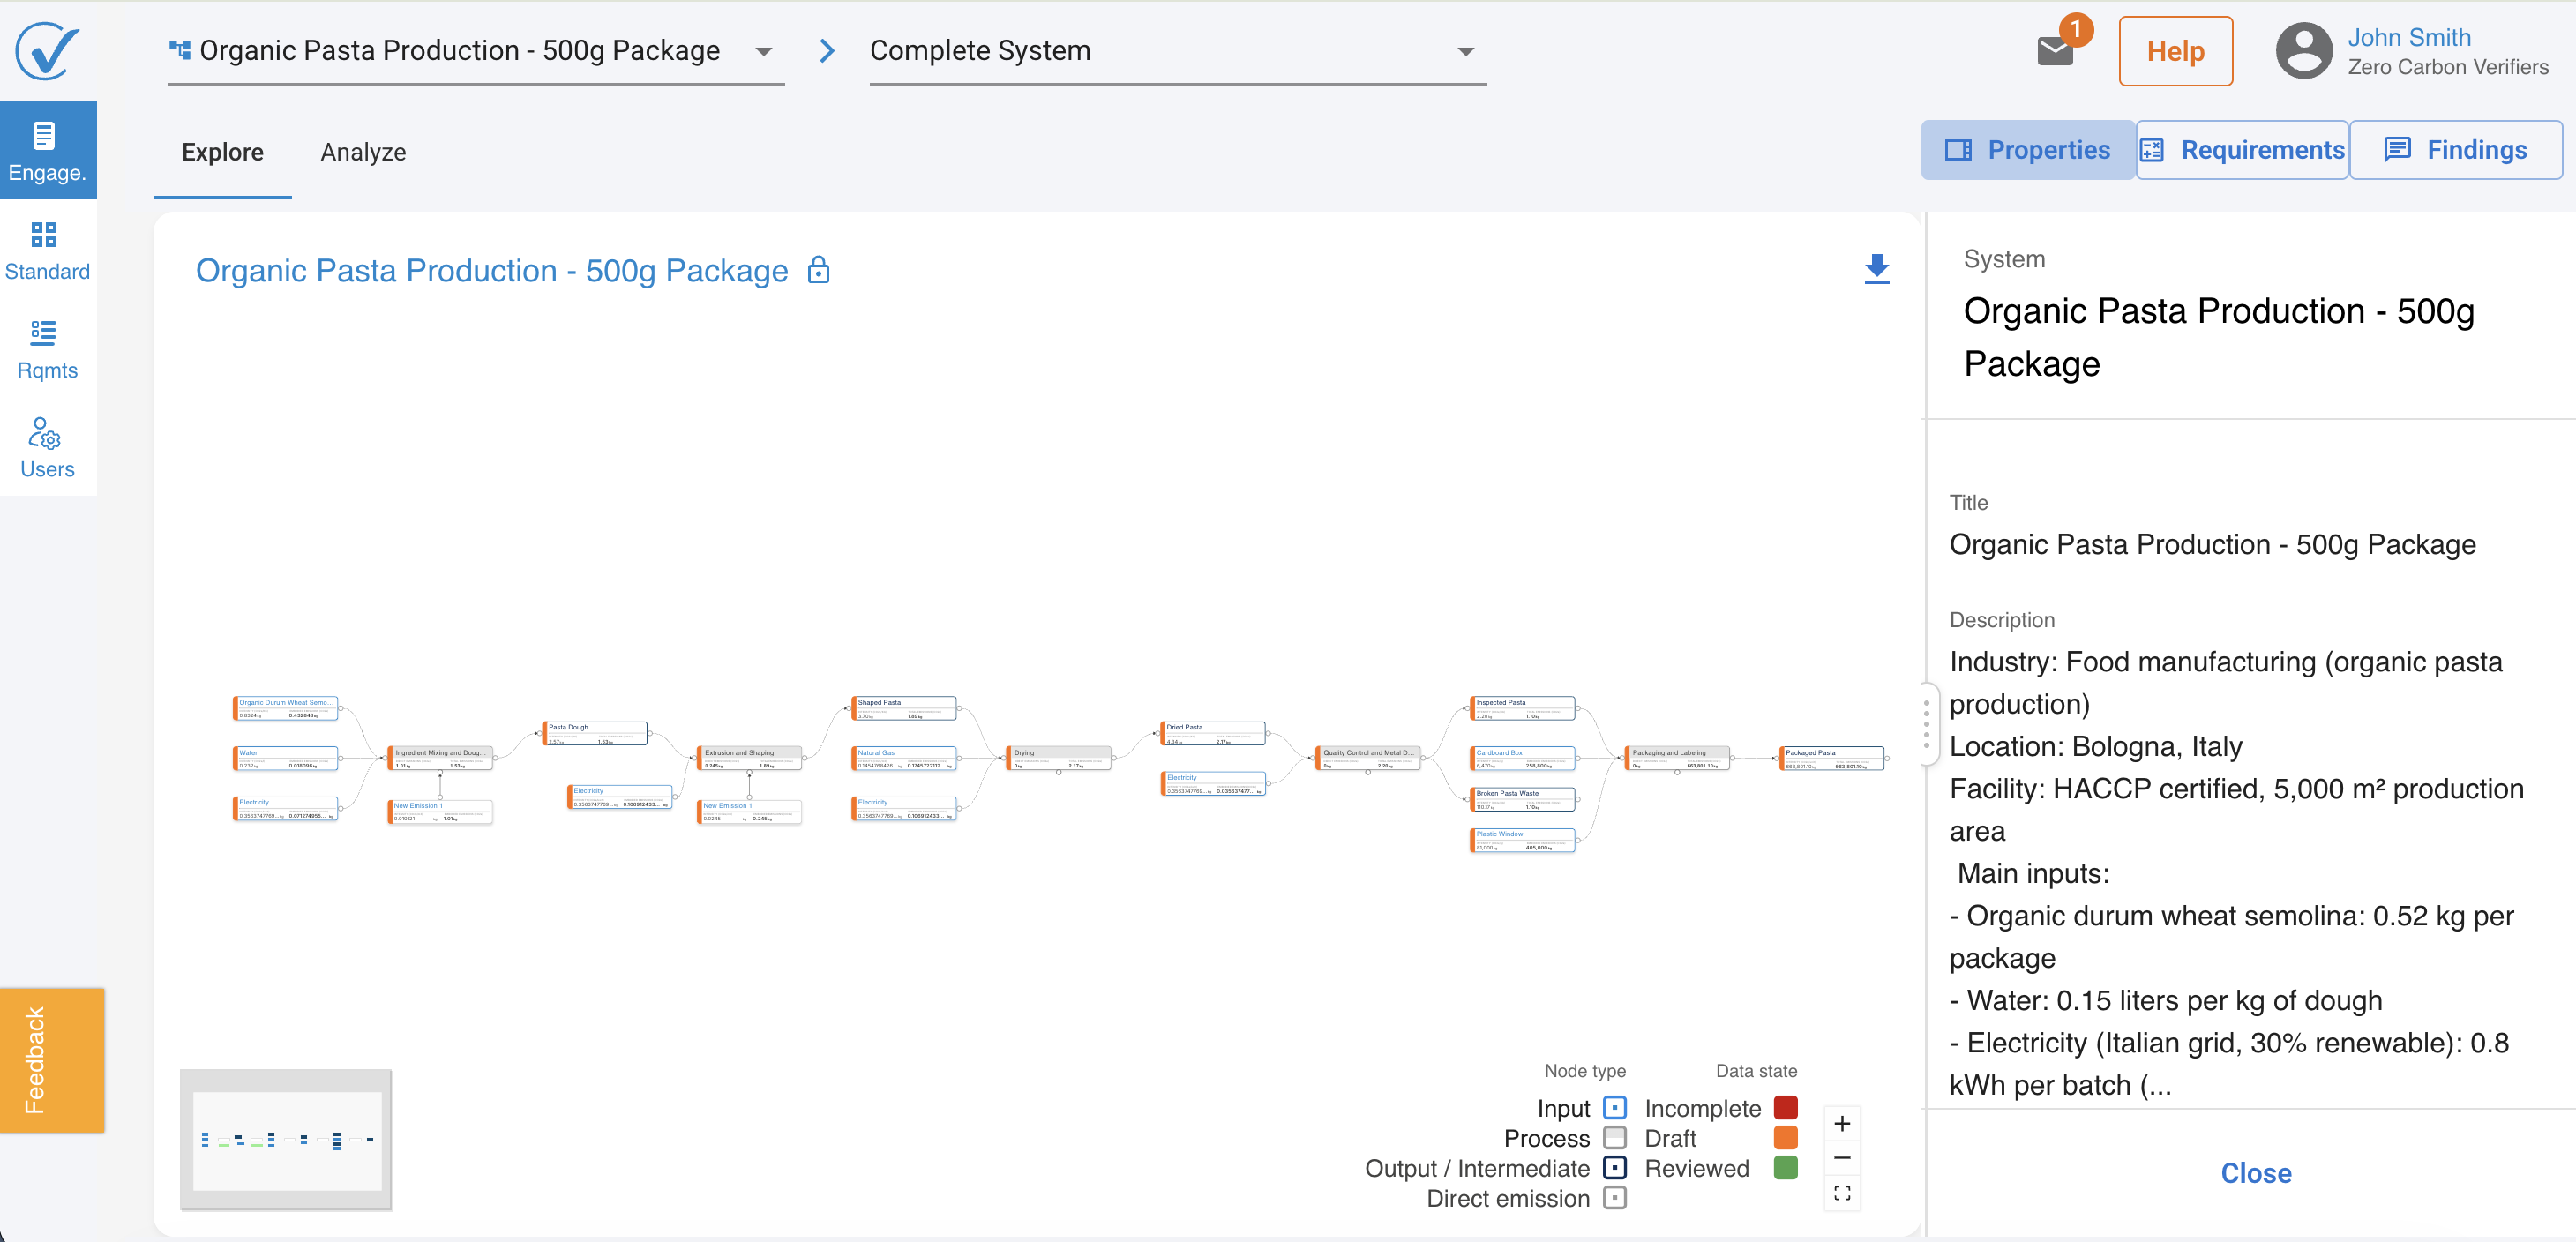
Explore is the default view and the starting point for most reviews. It renders the system as a flow diagram — the visual representation of the declared system boundary and how material and energy flows through it.
Three node types appear on the canvas:
- Inputs: Raw materials, energy carriers, ancillary materials entering the system boundary. Scope 2 and 3 emissions.
- Direct emissions: scope 1 emissions.
- Processes: Transformation steps within the boundary - where inputs are consumed and emissions are generated.
- Outputs: Products, co-products, waste, and emissions leaving the system — including the functional unit being verified.
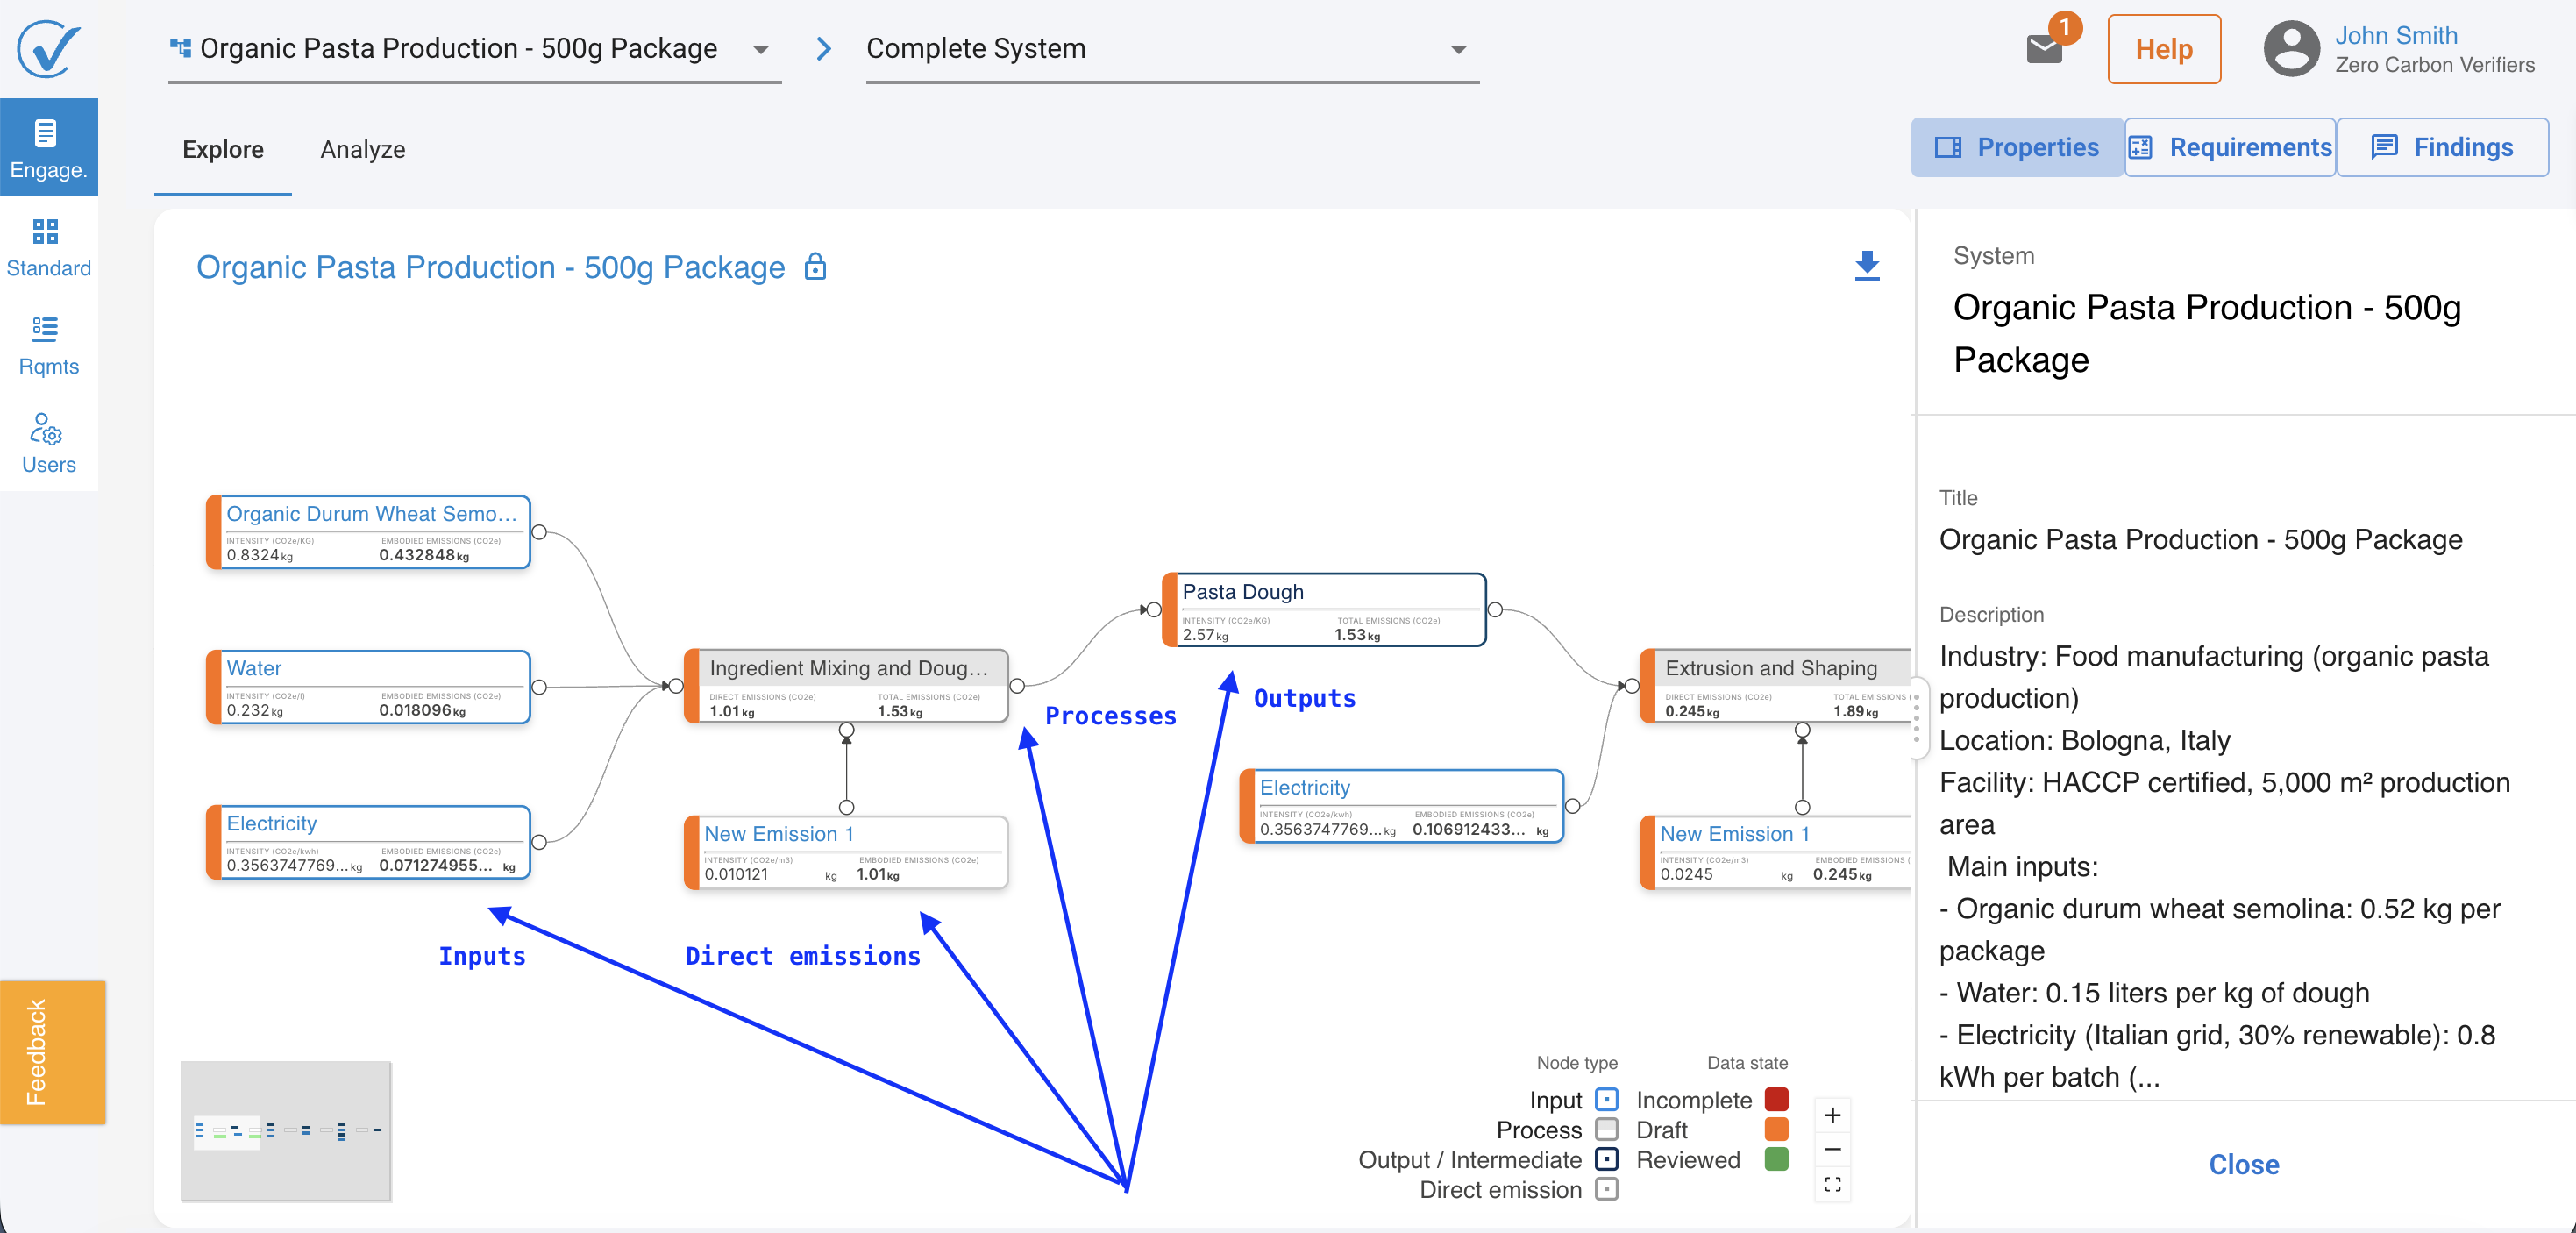
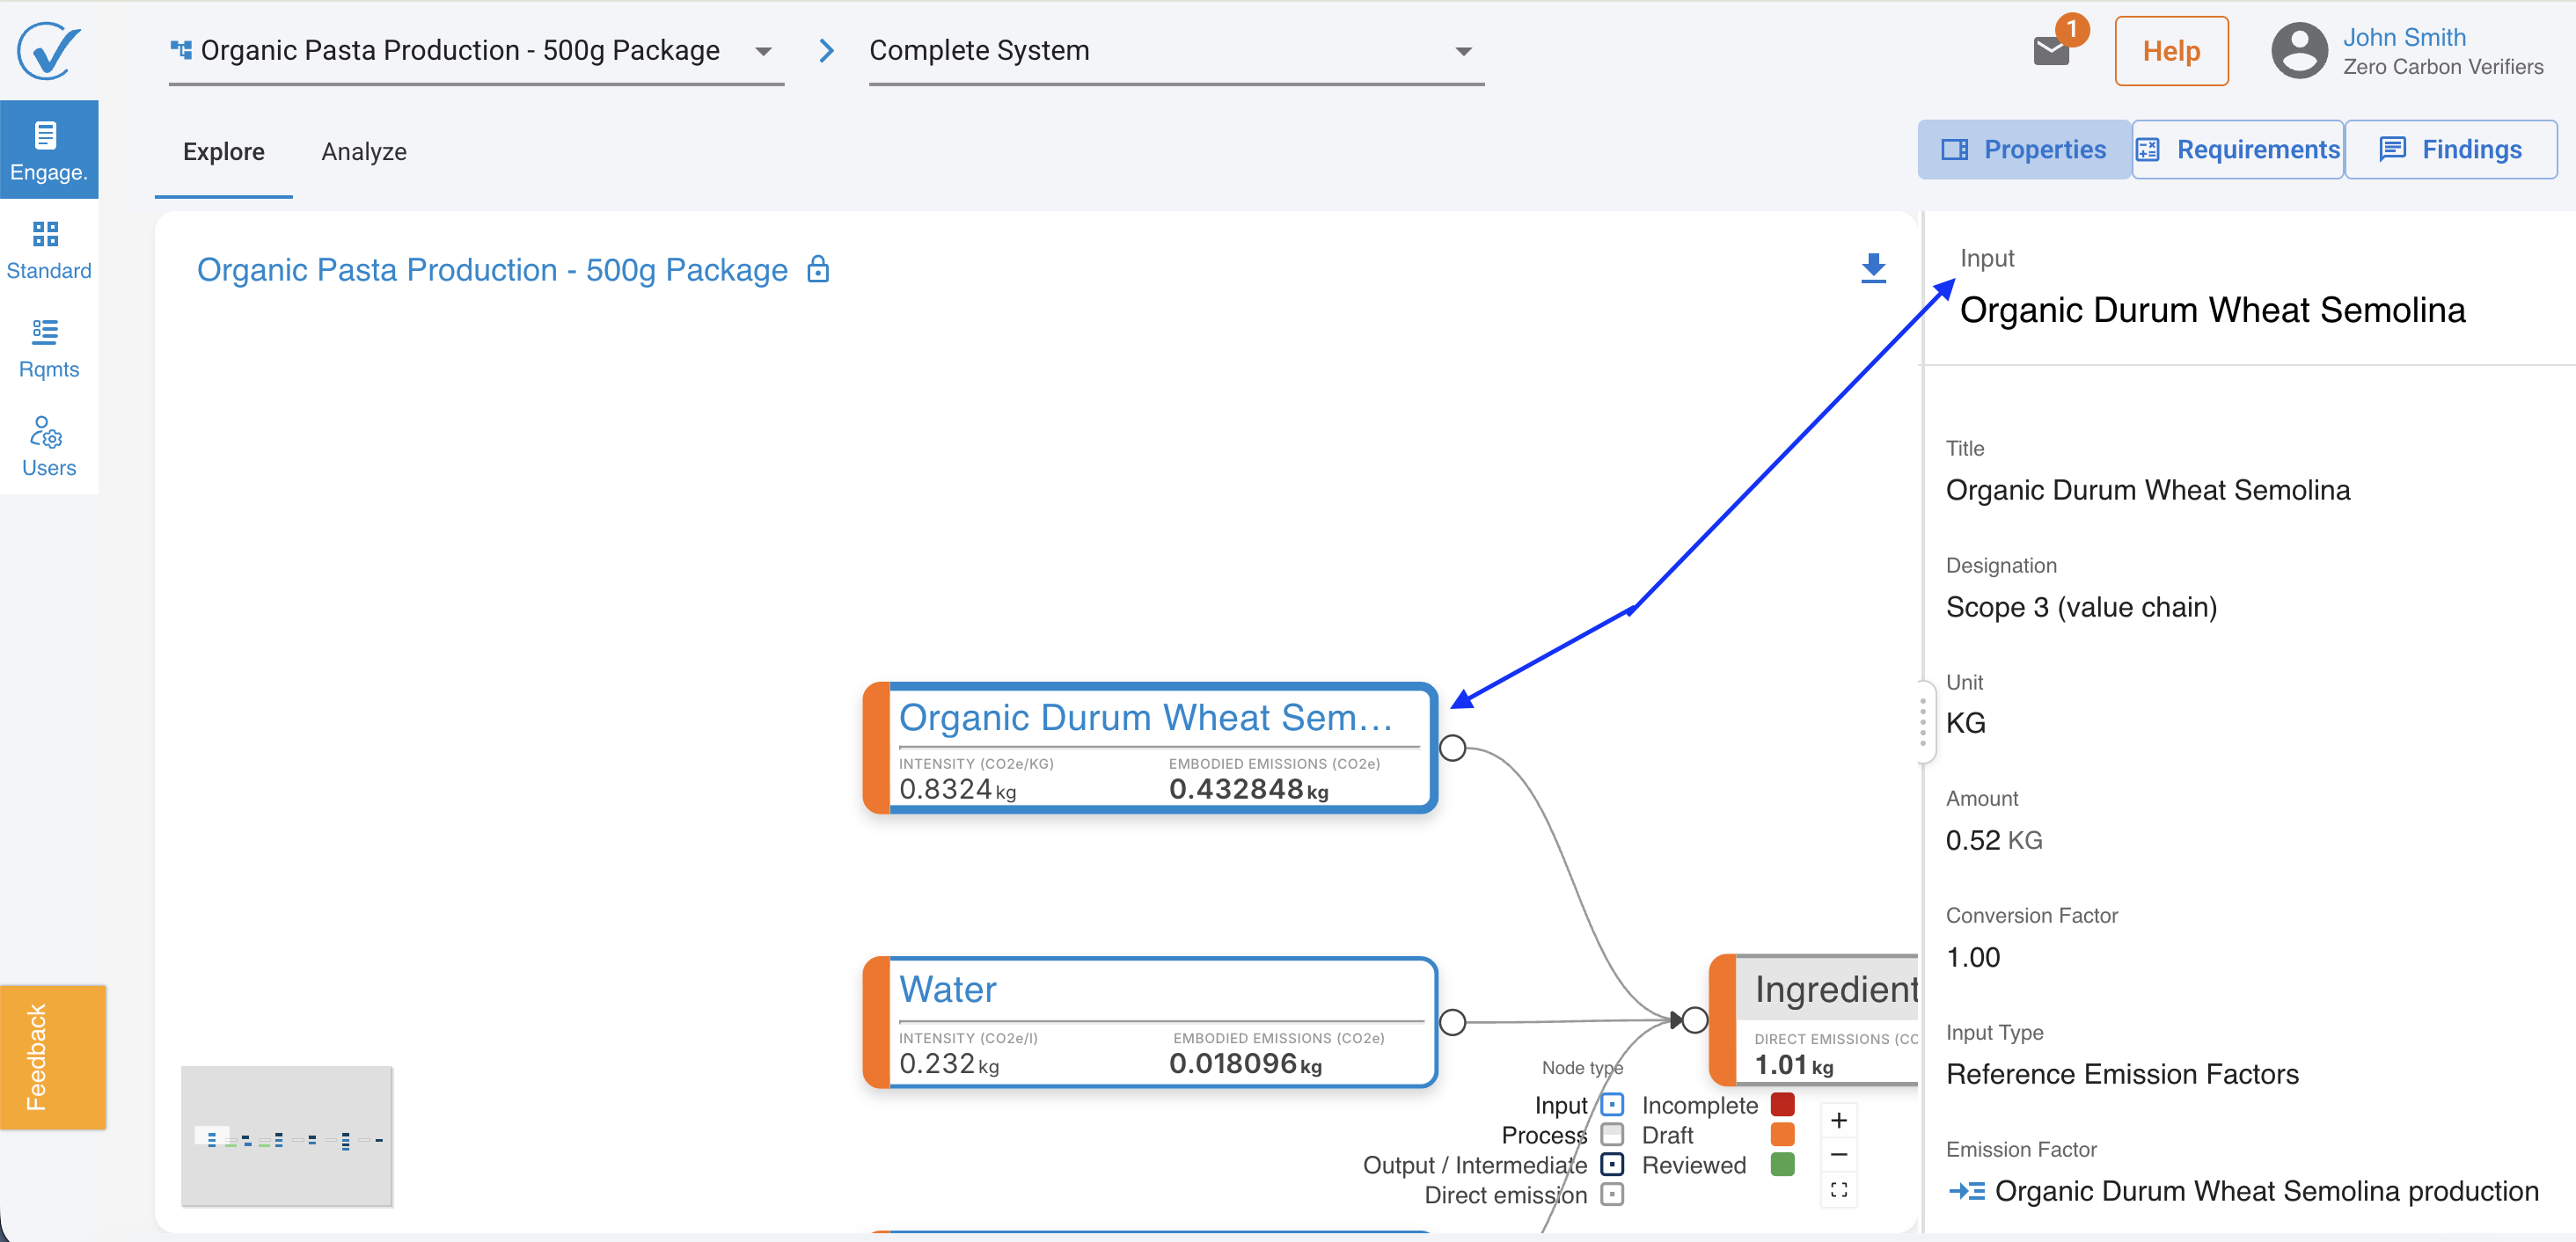
Clicking a node
Clicking any node in the Explore canvas updates the Properties pane on the right to show the data declared for that node — its inputs, emission factors, activity data, references, and any supporting documentation attached to it. This is the primary way to drill into the detail behind a specific process or input.
Analyze, Sankey and Bar Chart views
These three views show the numbers behind the model rather than its structure. The underlying data is identical to Explore — you're looking at it through a different lens, depending on what you need to interrogate.
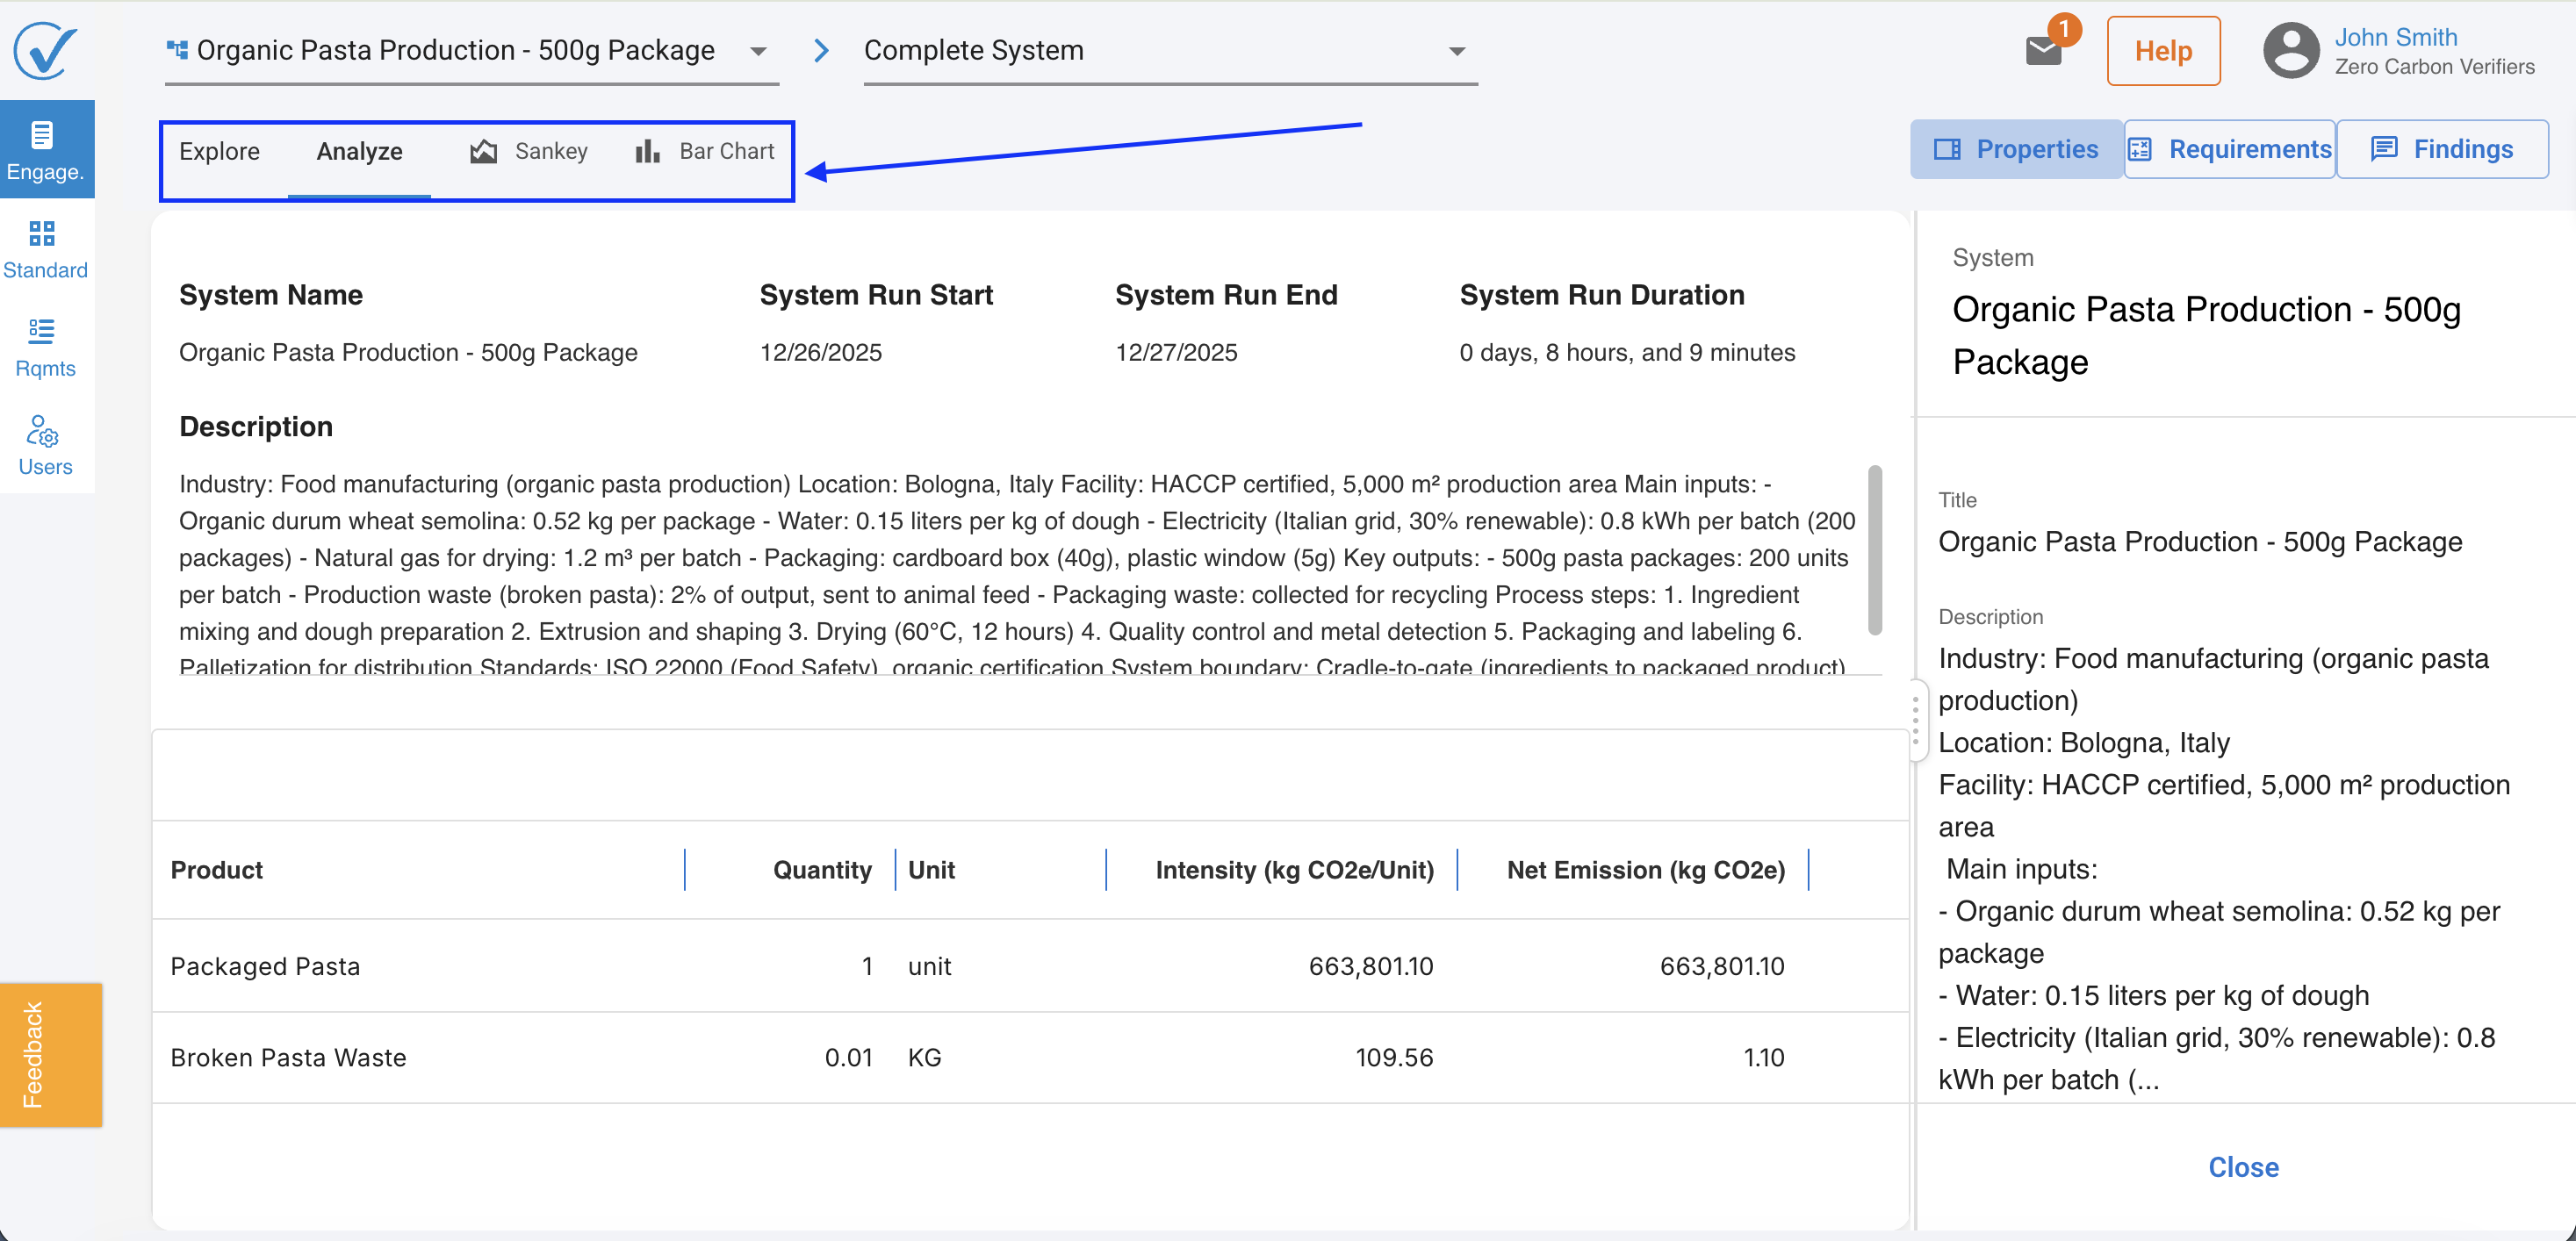
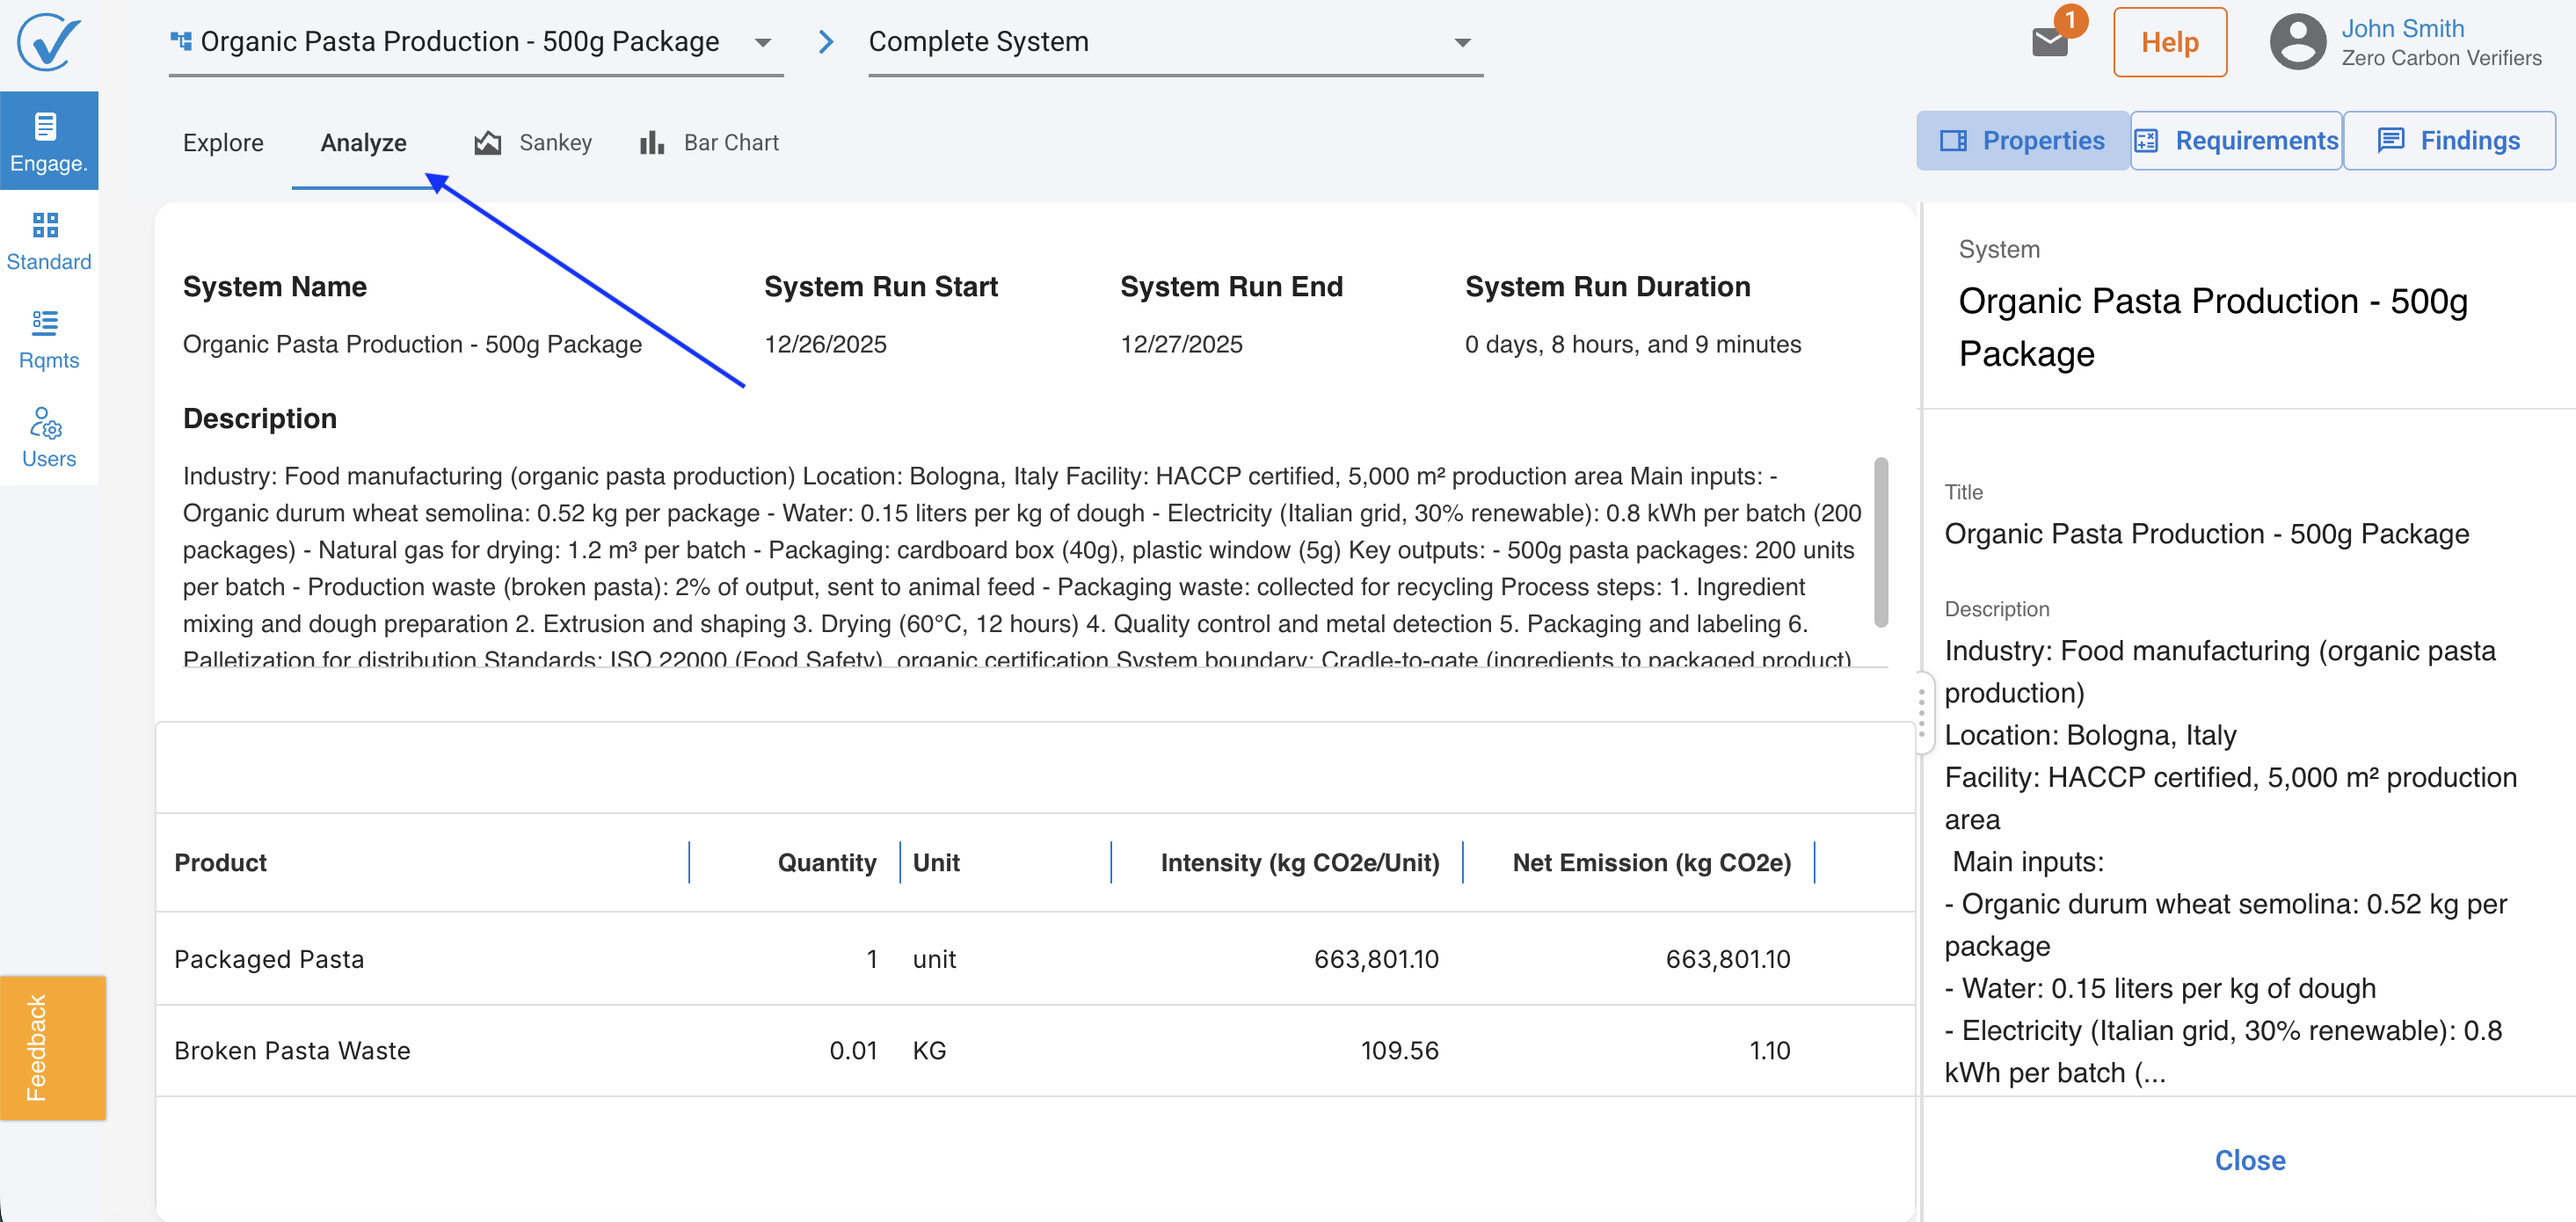
Analyze
Switches the canvas to a tabular results view. Shows calculated emissions by process, input category, or scope — depending on the standard in scope. Use this when you need to cross-check totals, verify allocation methods, or confirm that the declared functional unit aligns with the calculated footprint.
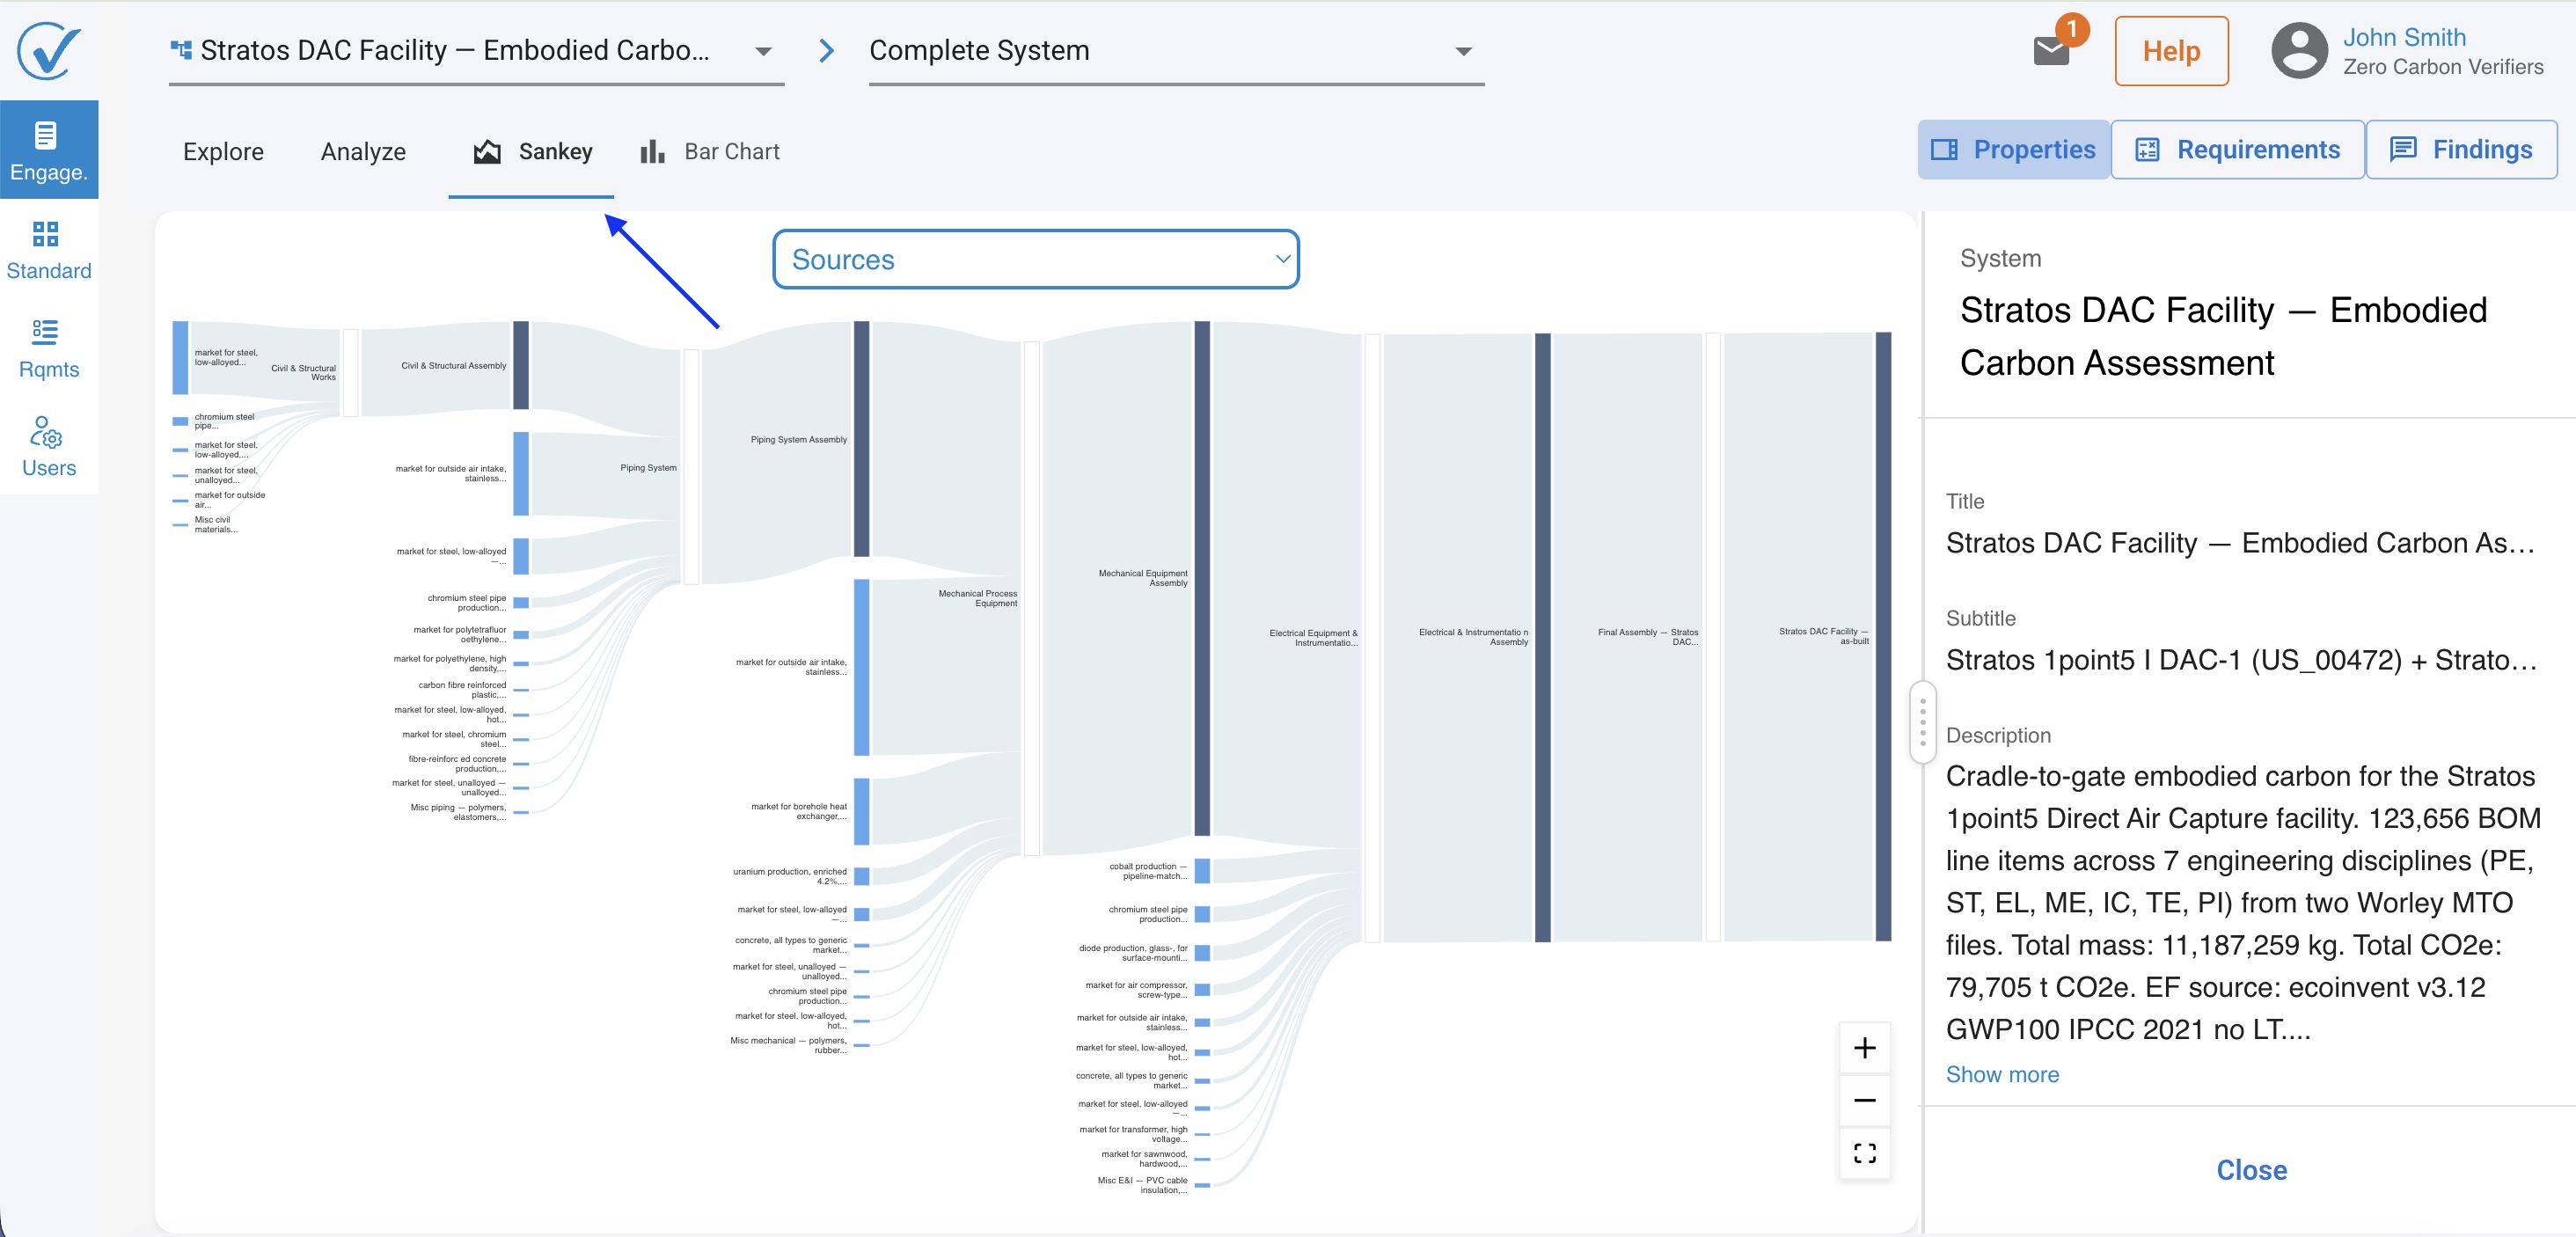
Sankey diagram
Renders the system as a Sankey flow diagram, where the width of each flow is proportional to the emissions it carries. This is the most efficient view for identifying where emissions concentrate across the system — a key step in risk-based sampling under ISO 14064-3, where you prioritise material issues based on contribution to the total footprint.
Bar Chart
Provides side-by-side comparisons across products, processes, or impact categories within the system. Useful when the engagement covers multiple products and you need to assess whether the allocation between them is reasonable.
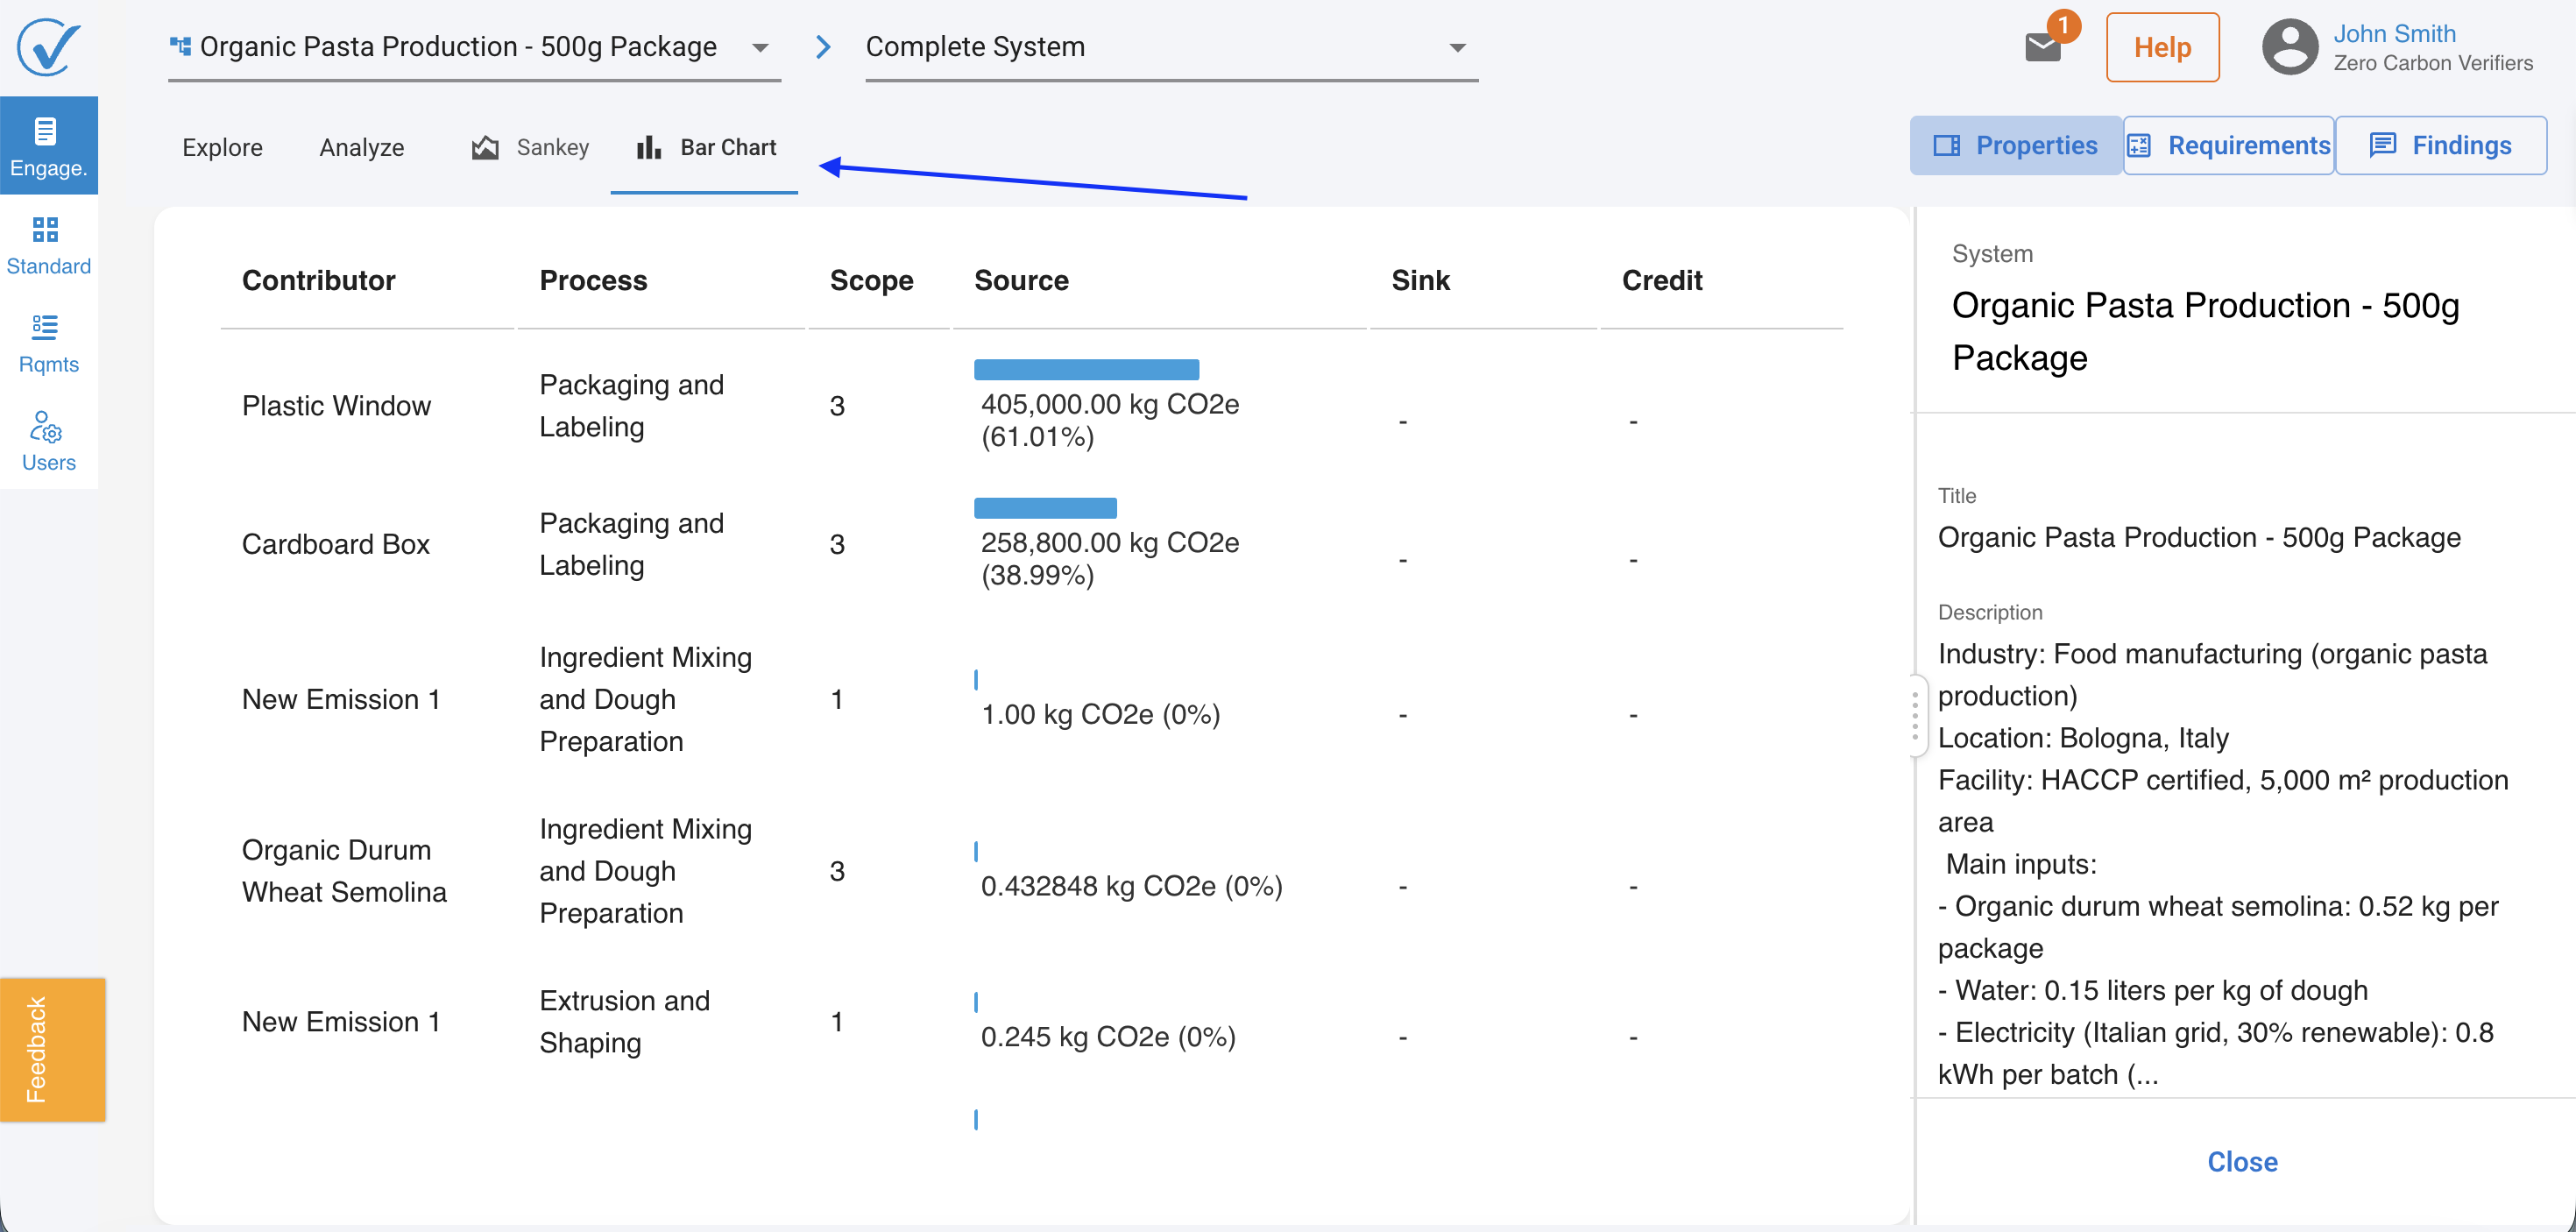
Note: Analyze, Sankey, and Bar Chart reflect the client's declared data and calculations. If you identify an error in the underlying data (e.g. a wrong emission factor), record it as a finding — the view itself does not validate the inputs.
The three right-hand panes
Three panes sit on the right side of the screen and remain visible regardless of which canvas view you're using. Together they form the core of your verification workflow.
- Properties: Shows the declared metadata for the current system: boundaries, reporting period, functional unit, declared methodology, and applicable standards. When you click a node in Explore, this pane updates to show that node's detail — its declared data, emission factors, and references.
- Requirements: Lists every verification requirement linked to the standards in scope for this engagement, pulled automatically from your organisation's library. Each requirement shows its current status. This is your checklist.
- Findings: A consolidated view of every finding you've raised so far in this engagement — across all requirements and all nodes. Your running record of the review. Open, resolved, and pending items all appear here.
Putting it together: a typical review pass
The three panes work as a triangle. Properties tells you what's been declared. Requirements tells you what it needs to satisfy. Findings records what you've concluded. A standard review pass moves between all three.
- Start in Explore — understand the system boundary
Orient yourself to the declared scope. Check the Properties pane for the functional unit, reporting period, and declared methodology before touching any node-level data. - Use Sankey to identify material hotspots
Switch to the Sankey view to see where emissions concentrate. Under ISO 14064-3 and ISO 14067, your sampling approach should prioritise processes and inputs that contribute most significantly to the total — Sankey makes this immediately visible. - Drill into nodes in Explore
Return to Explore and click into the hotspot processes. The Properties pane updates to show the declared data for that node. Check the emission factor source, activity data basis, and any referenced documentation. - Check against Requirements
Open the Requirements pane and find the relevant requirement for what you've just reviewed. Confirm whether the declared data satisfies it — or whether a finding is warranted. - Raise a finding if needed
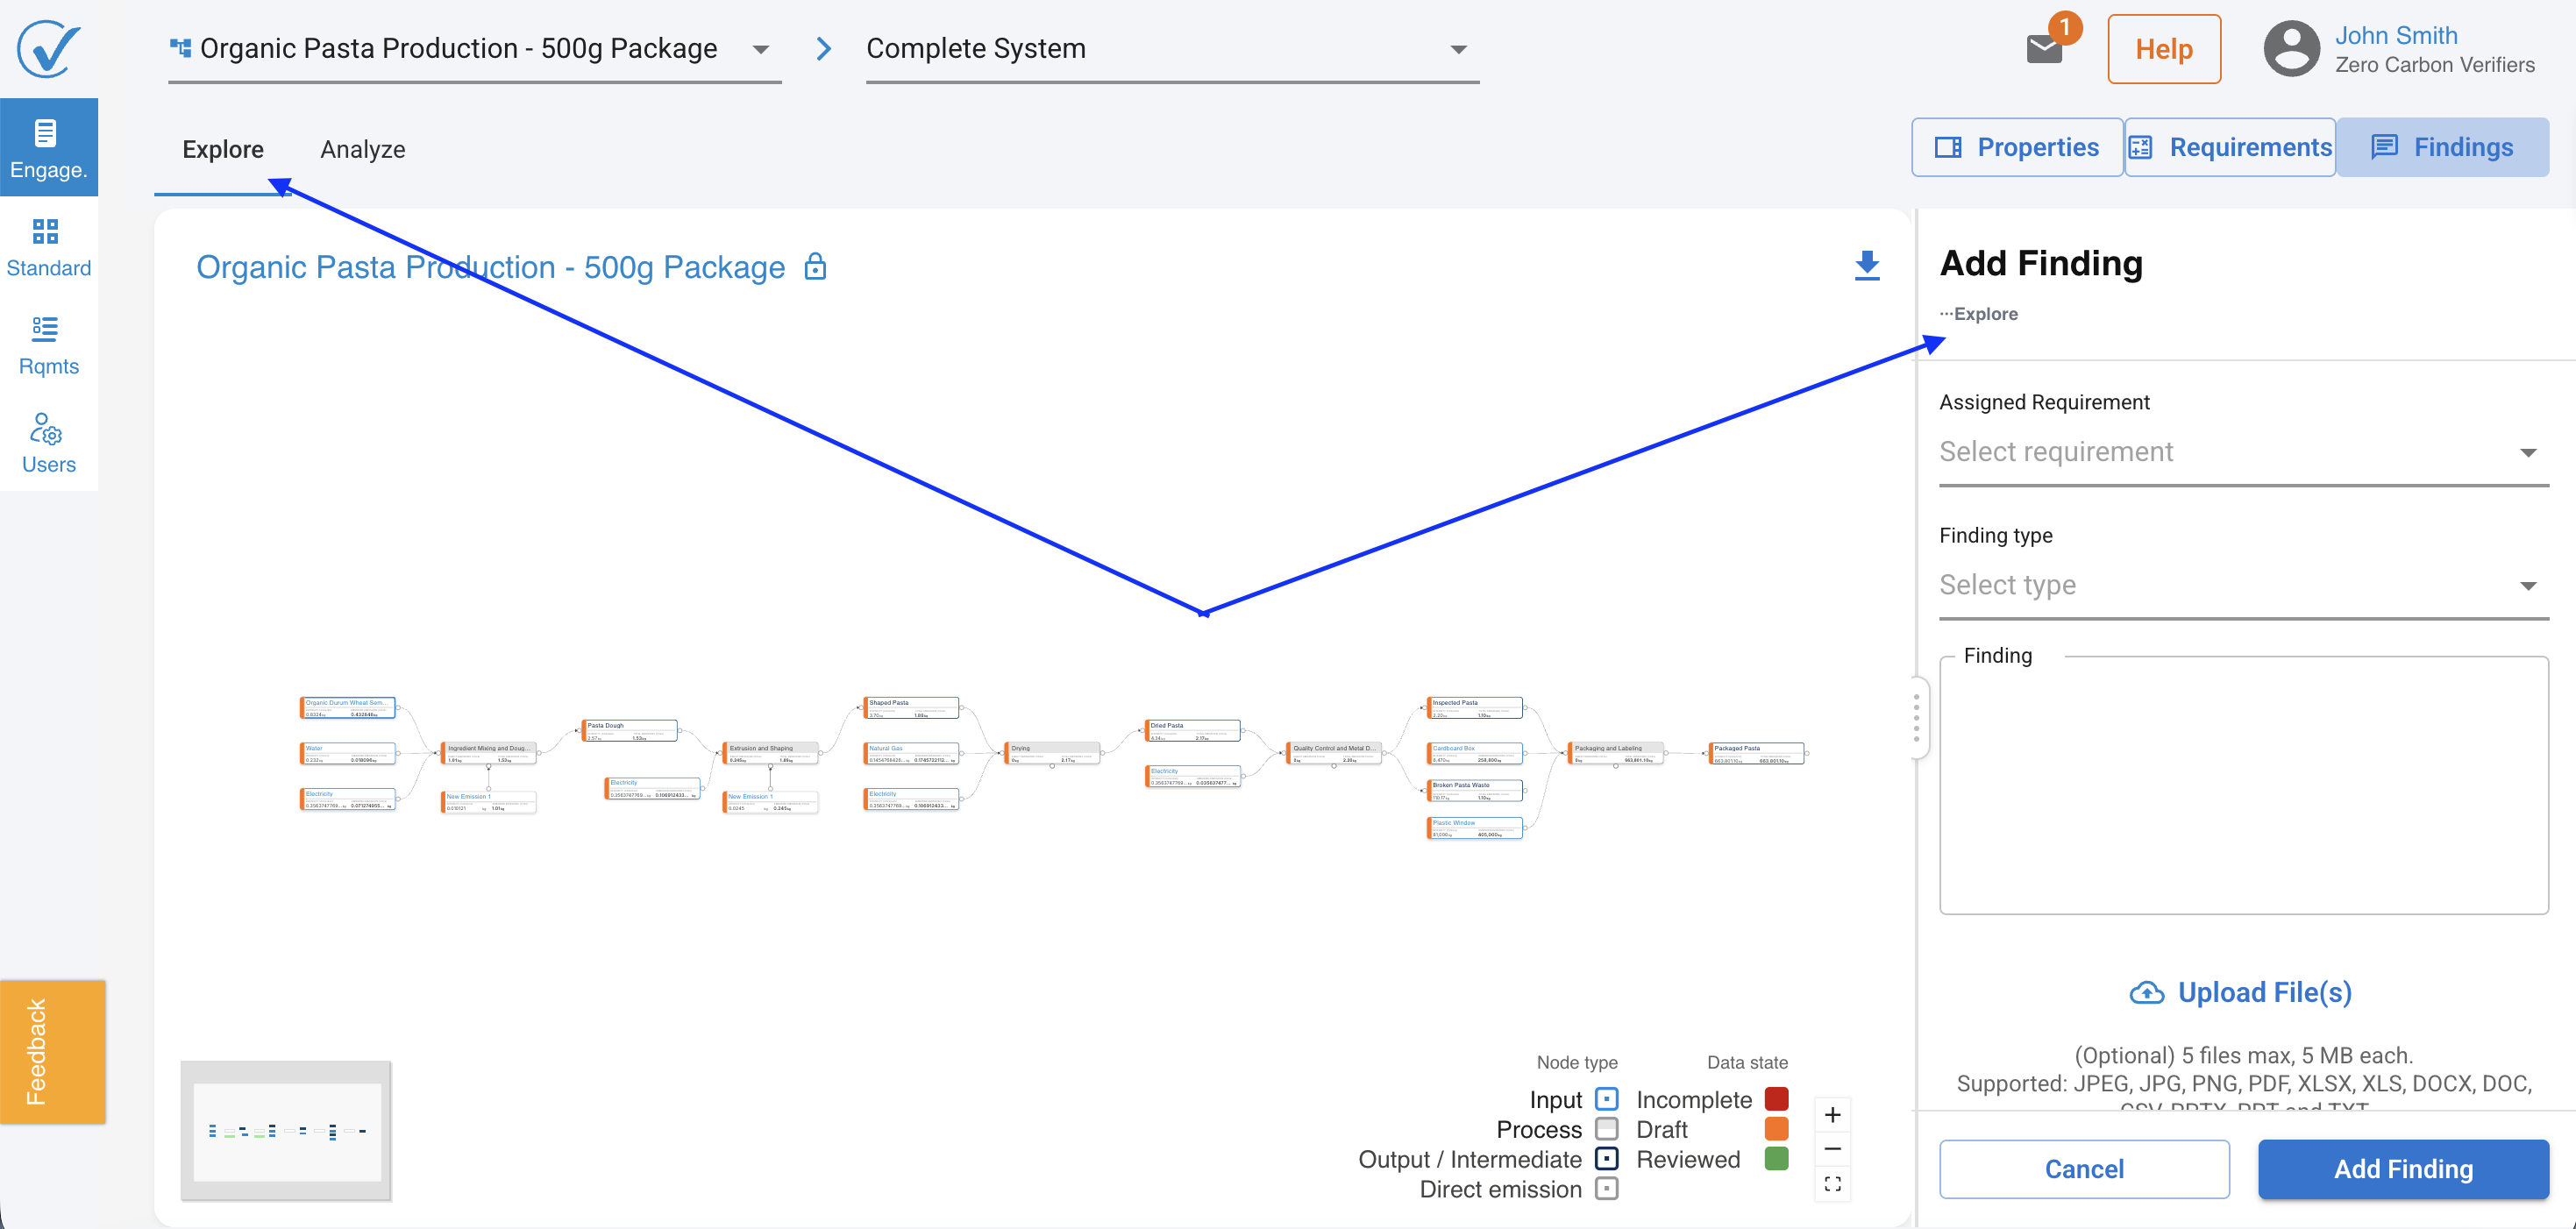
Use+ Findingfrom the Findings pane. The location path is pre-filled based on where you were in the model when you clicked — linking the finding directly to the relevant node and requirement. Review the pre-filled location before submitting. - Track progress in the Findings pane
The Findings pane shows your running total of open and resolved items. Use this to confirm you've covered the scope before moving to your verification opinion.
On finding location: When you click + Finding while a node is selected in Explore, CarbonSig automatically pre-fills the location path with the system, process, and node you were reviewing. Always verify this path before saving — it's the traceability chain that makes your findings audit-defensible.
Related articles:
Verifier Hub
Last updated June 2026