
Analyze Your System Model (Analyze Tab)
Time to review: 2-3 minutes
View calculation results, product carbon footprints, and emission breakdowns.
What is the Analyze Tab?
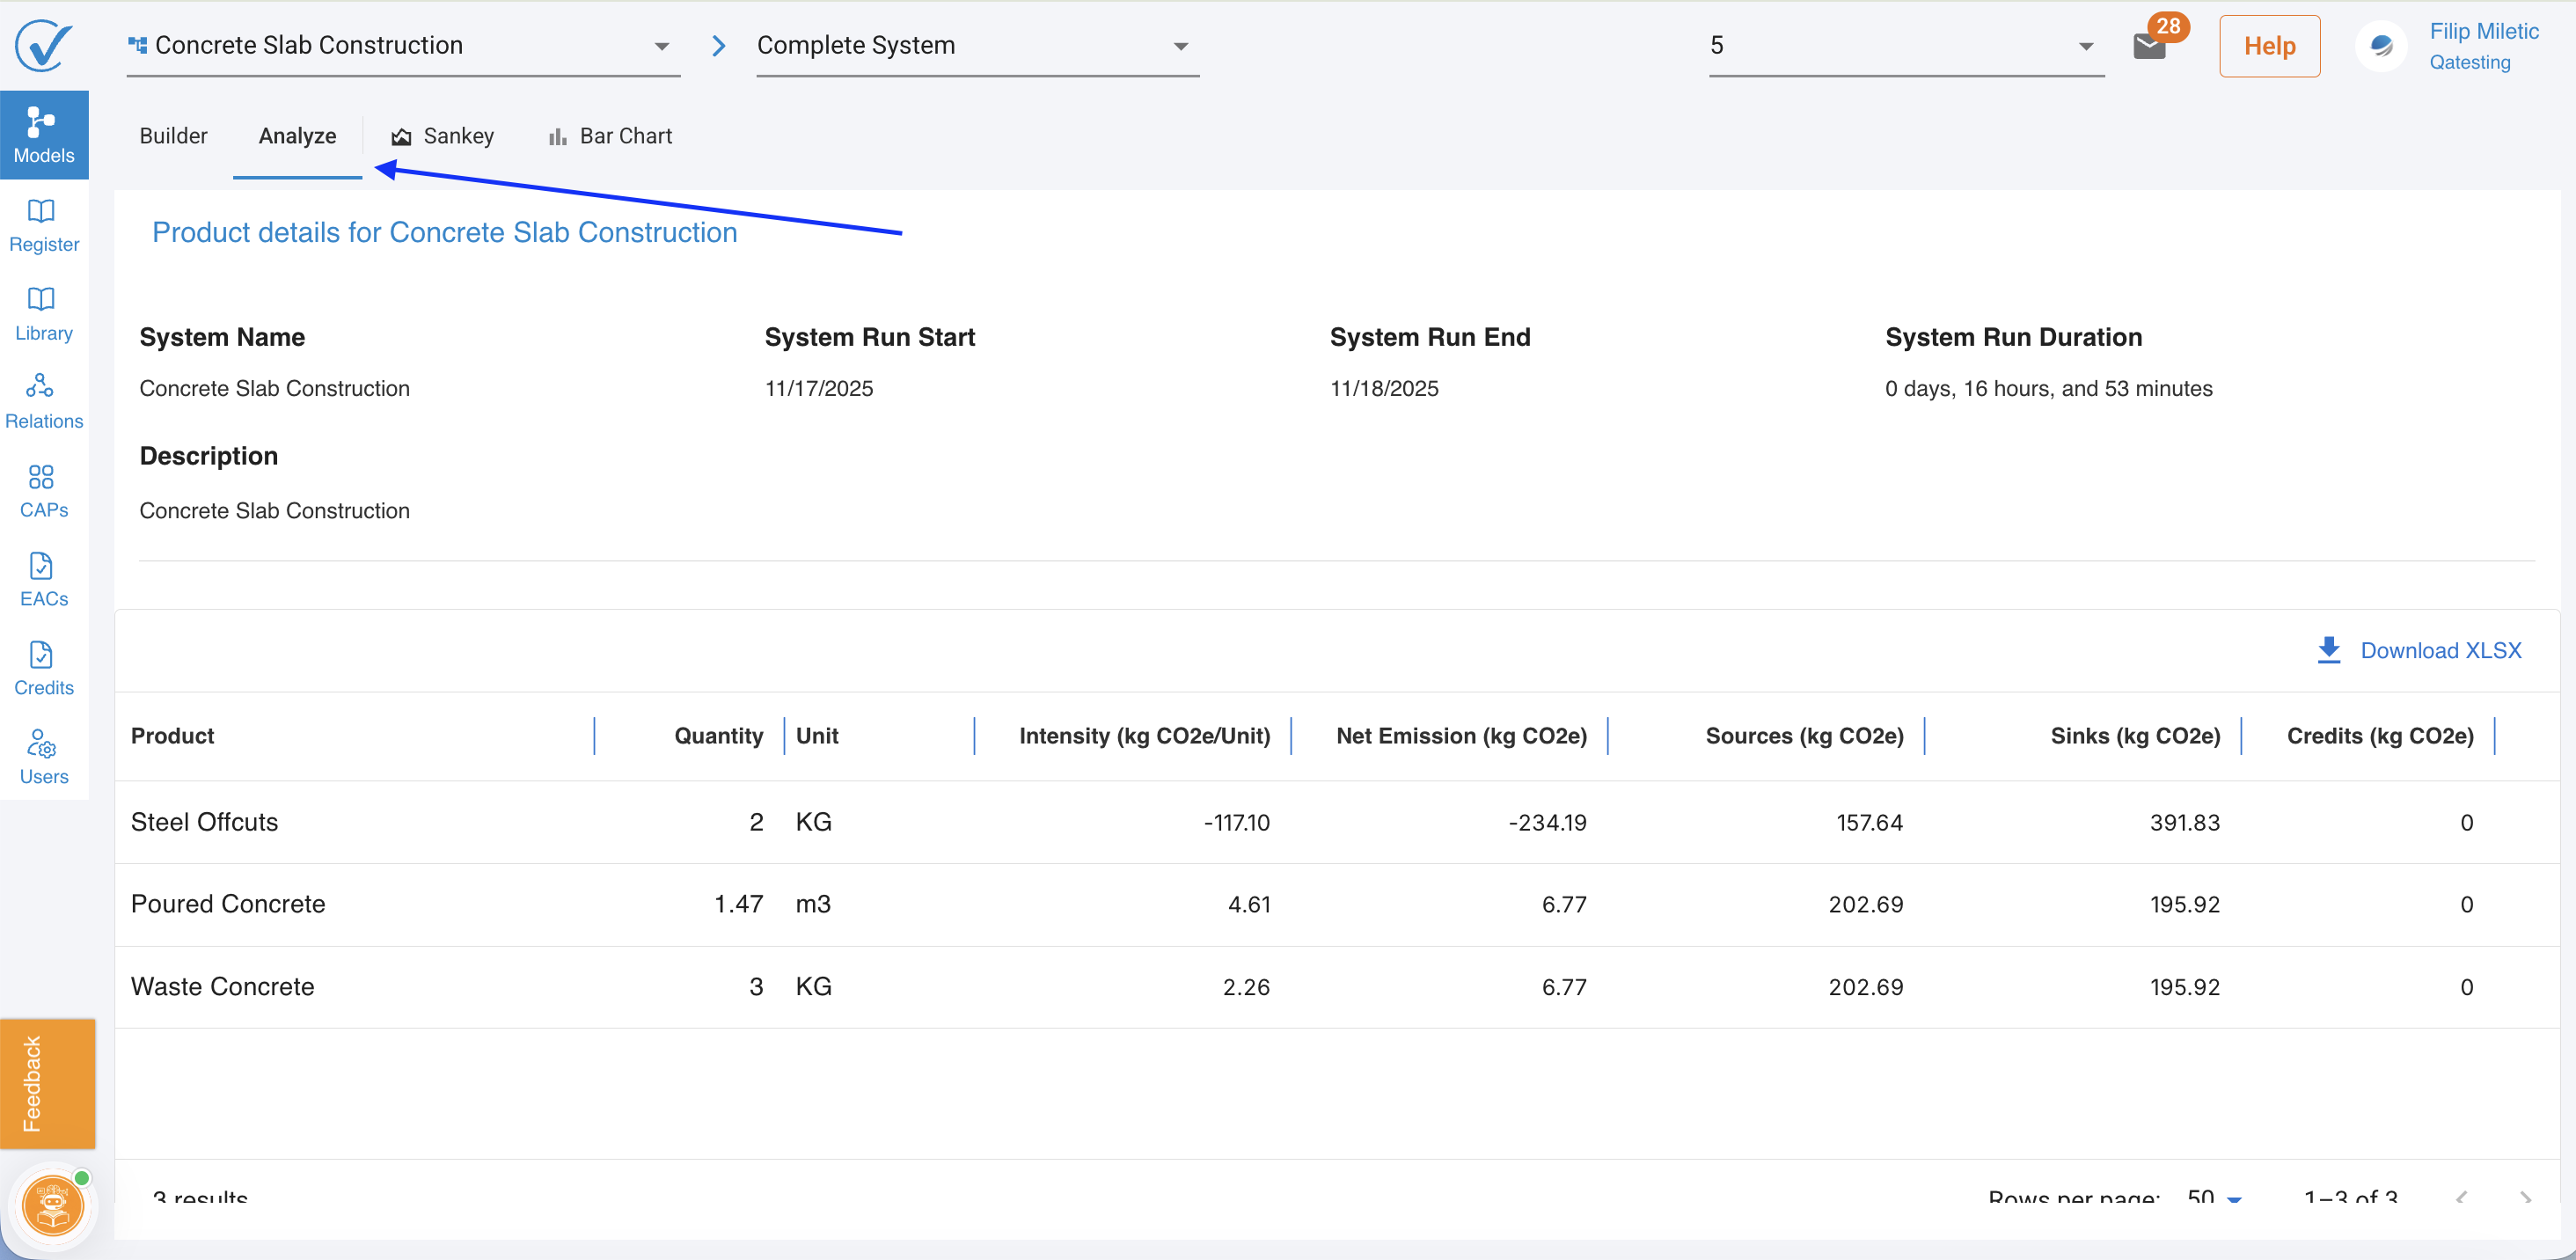
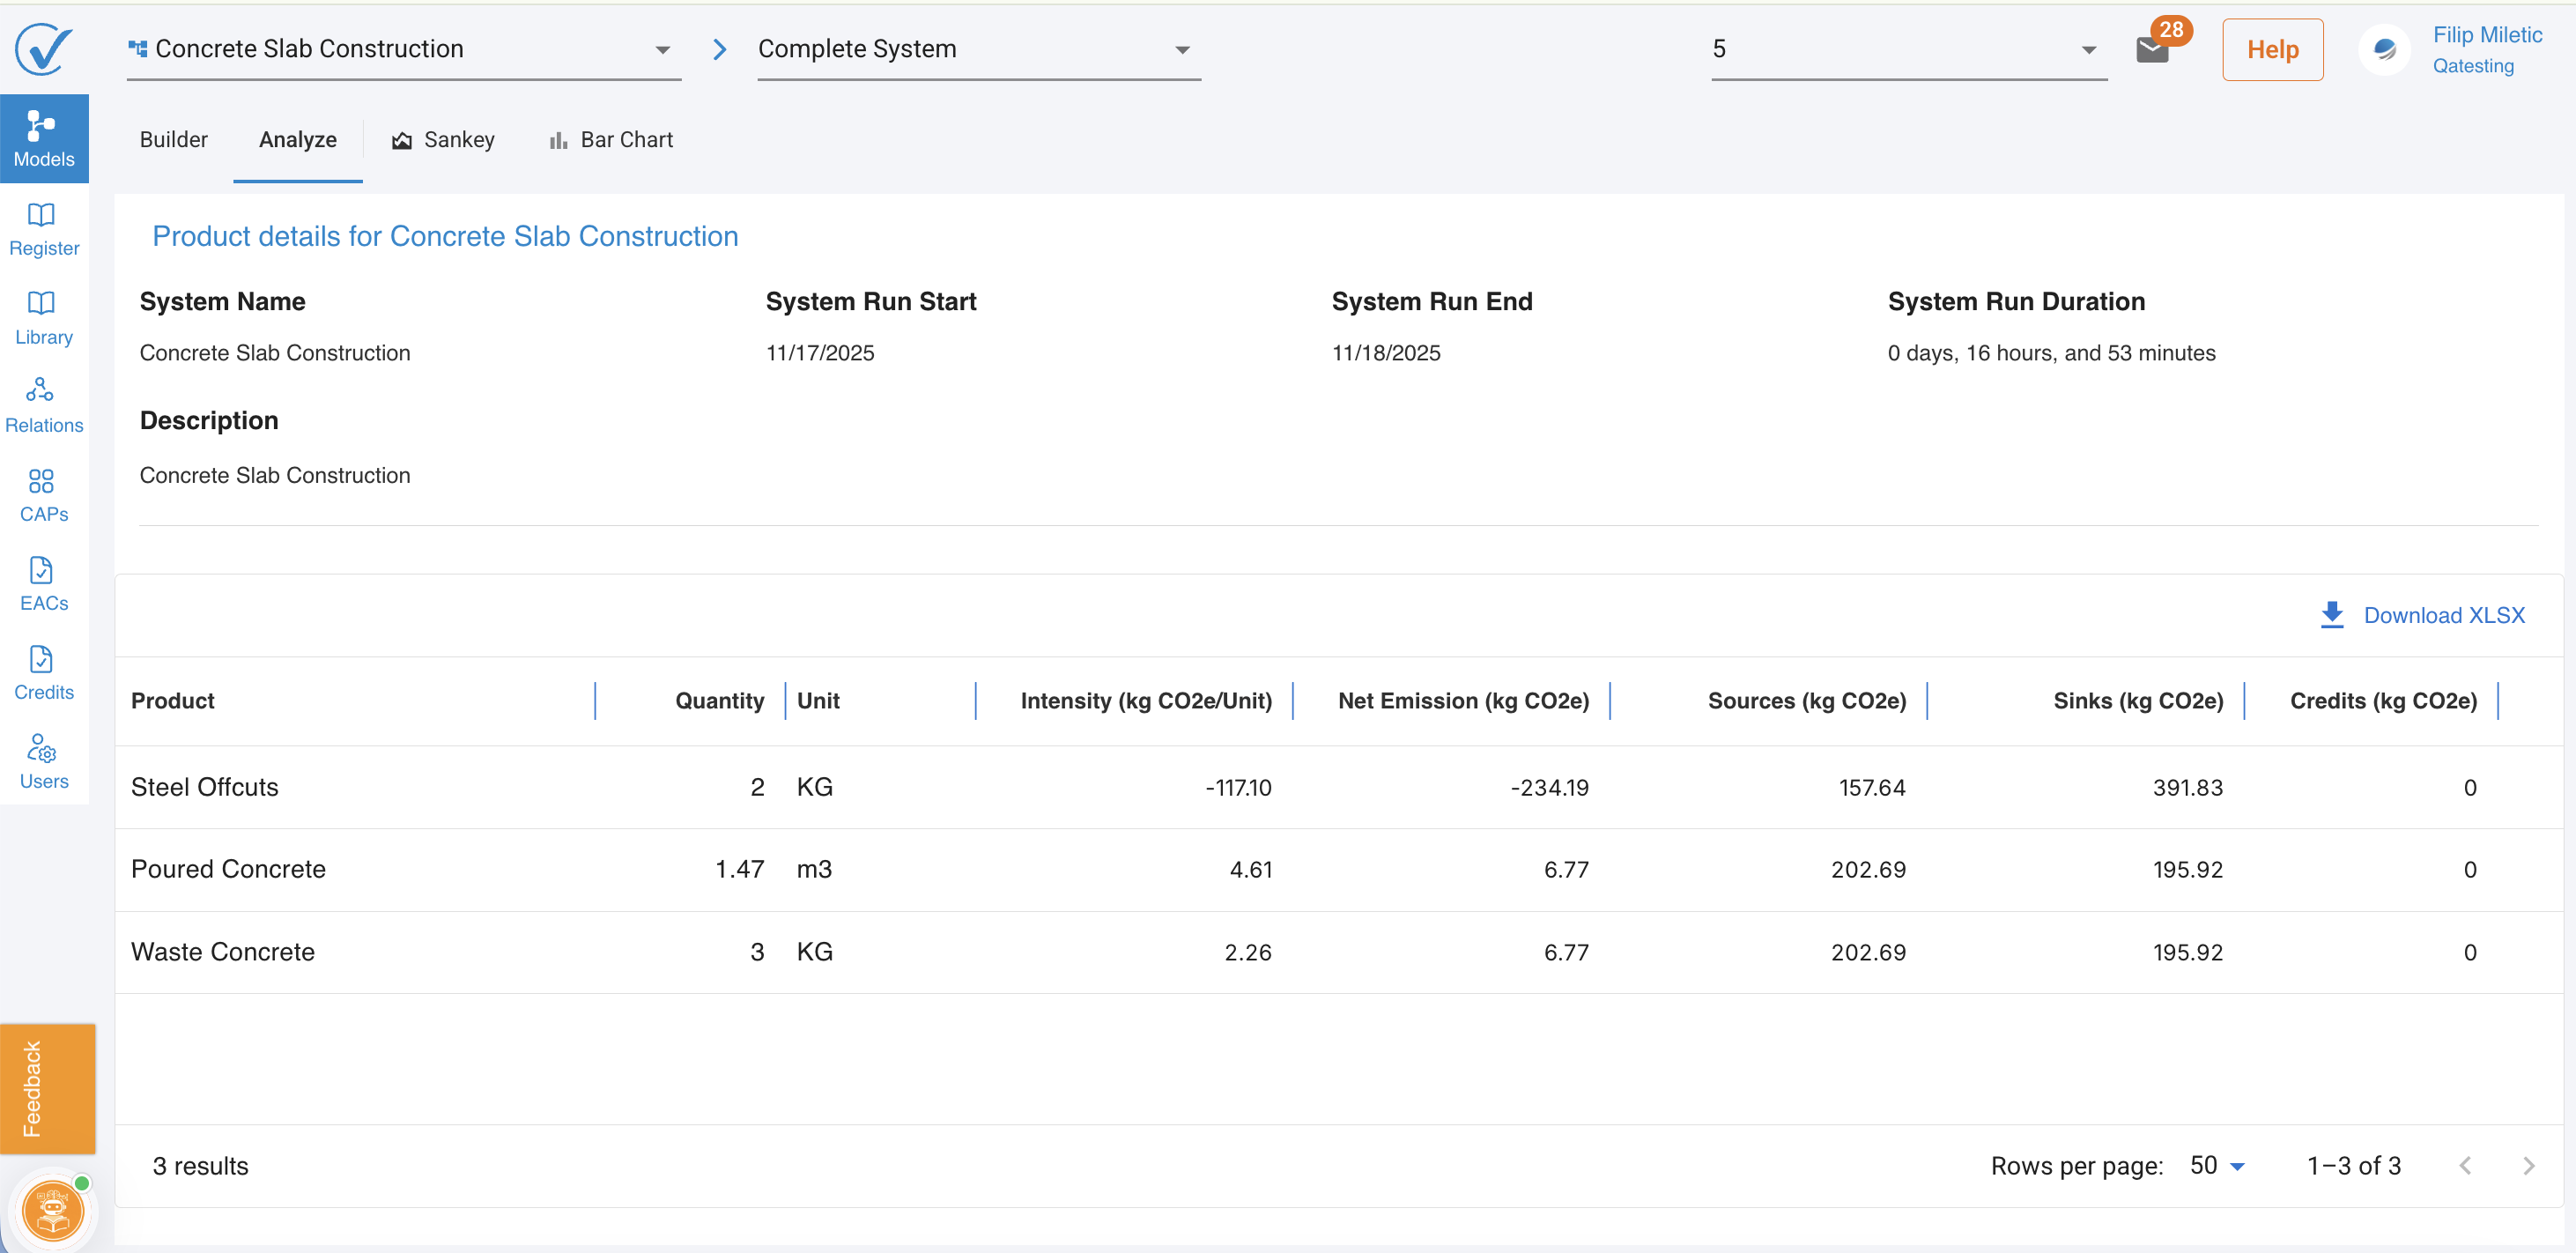
The Analyze tab displays the calculated results of your model after you've completed data entry. Here you'll see:
- Product-level carbon footprints for all outputs
- Emission breakdowns by source, sink, and credits
- Visual analysis tools (Sankey diagrams, bar charts)
- System performance metrics
Requirement: Your model must have "Ready" status to see complete results.
Understanding the Results View
Model Information Panel
At the top of the page, you'll see key model details:
- Model Name - Your model's identifier
- System Run Start/End - The time period covered by calculations
- System Run Duration - How long the model represents (days, hours, minutes)
- Description - Your model's purpose and scope
Product Results Table
The main table shows carbon footprint calculations for each output product:
| Column | What It Shows | Example |
|---|---|---|
| Product | Output name from your model | "Poured Concrete" |
| Quantity | Amount produced | 1.47 |
| Unit | Measurement unit | m3 |
| Intensity (kg CO₂e) | Carbon per unit of product | 4.61 kg CO₂e/m3 |
| Net Emission (kg CO₂e) | Total emissions after sinks and credits | 6.77 kg CO₂e |
| Sources (kg CO₂e) | Total emissions generated | 202.69 kg CO₂e |
| Sinks (kg CO₂e) | Carbon removed or sequestered | 195.92 kg CO₂e |
| Credits (kg CO₂e) | Offsets applied | 0 |
Understanding Emissions Calculations
How Net Emissions Are Calculated
Net Emission = Sources - Sinks - Credits
Example from the table:
- Poured Concrete (1.47 m3)
- Sources: 202.69 kg CO₂e (all emissions generated)
- Sinks: 195.92 kg CO₂e (carbon absorbed/removed)
- Credits: 0 kg CO₂e (no offsets applied)
- Net Emission: 6.77 kg CO₂e (final footprint)
- Intensity: 4.61 kg CO₂e/m3 (per unit)
Accessing Visualization Tools
Available Views:
- Analysis - Default table view (shown above)
- Sankey - Carbon flow diagram showing emission pathways
- Bar Chart - Ranked contributors to total emissions
Open a detail view:
Click on any product from the list:
- Opens a detailed view of the product's carbon footprint
- Shows complete emission breakdown by scope and process
- Useful for reviewing before registered and publish CAP
When to Use Analyze Tab
Review after data entry:
- Verify all calculations are correct
- Check for unexpected emission values
- Identify highest-impact products
Before move model to Registered tab:
- Ensure results meet your quality standards
- Validate emission intensities are reasonable
- Review scope classifications
For reporting:
- Extract carbon footprint data
- Generate visual aids for presentations
- Support sustainability disclosures
Interpreting Negative Intensities
Example: Steel Offcuts (-117.10 kg CO₂e/KG)
Negative carbon intensity indicates:
- Product sequesters more carbon than it emits (sinks > sources)
- Common for by-products that avoid primary production
- Allocation credits from waste recovery
- Carbon removal or recycling benefits
Why this happens:
- Steel offcuts avoid virgin steel production
- Recycling credits allocated to the by-product
- System boundaries include avoided emissions
Common Result Patterns
High Sources, Low Net Emissions
- Indicates significant sinks or credits applied
- Check if allocation is appropriate
- Verify sink/credit data is accurate
Similar Intensity Across Products
- May indicate shared upstream processes
- Check allocation methodology
- Consider if products should have distinct profiles
Zero Credits Column
- No carbon offsets have been applied
- Credits are optional and added separately
- Contact your admin to apply organizational credits
Quick Actions Reference
| I want to... | Do this... |
|---|---|
| View detailed breakdown | Click product name or Preview |
| Create CAP | Click ⋮ menu → Publish |
| See emission flows | Results dropdown → Sankey |
| Identify hotspots | Results dropdown → Bar Chart |
| Check calculation basis | Review Sources, Sinks, Credits columns |
| Verify time period | Check System Run Start/End dates |
Sankey Diagram View
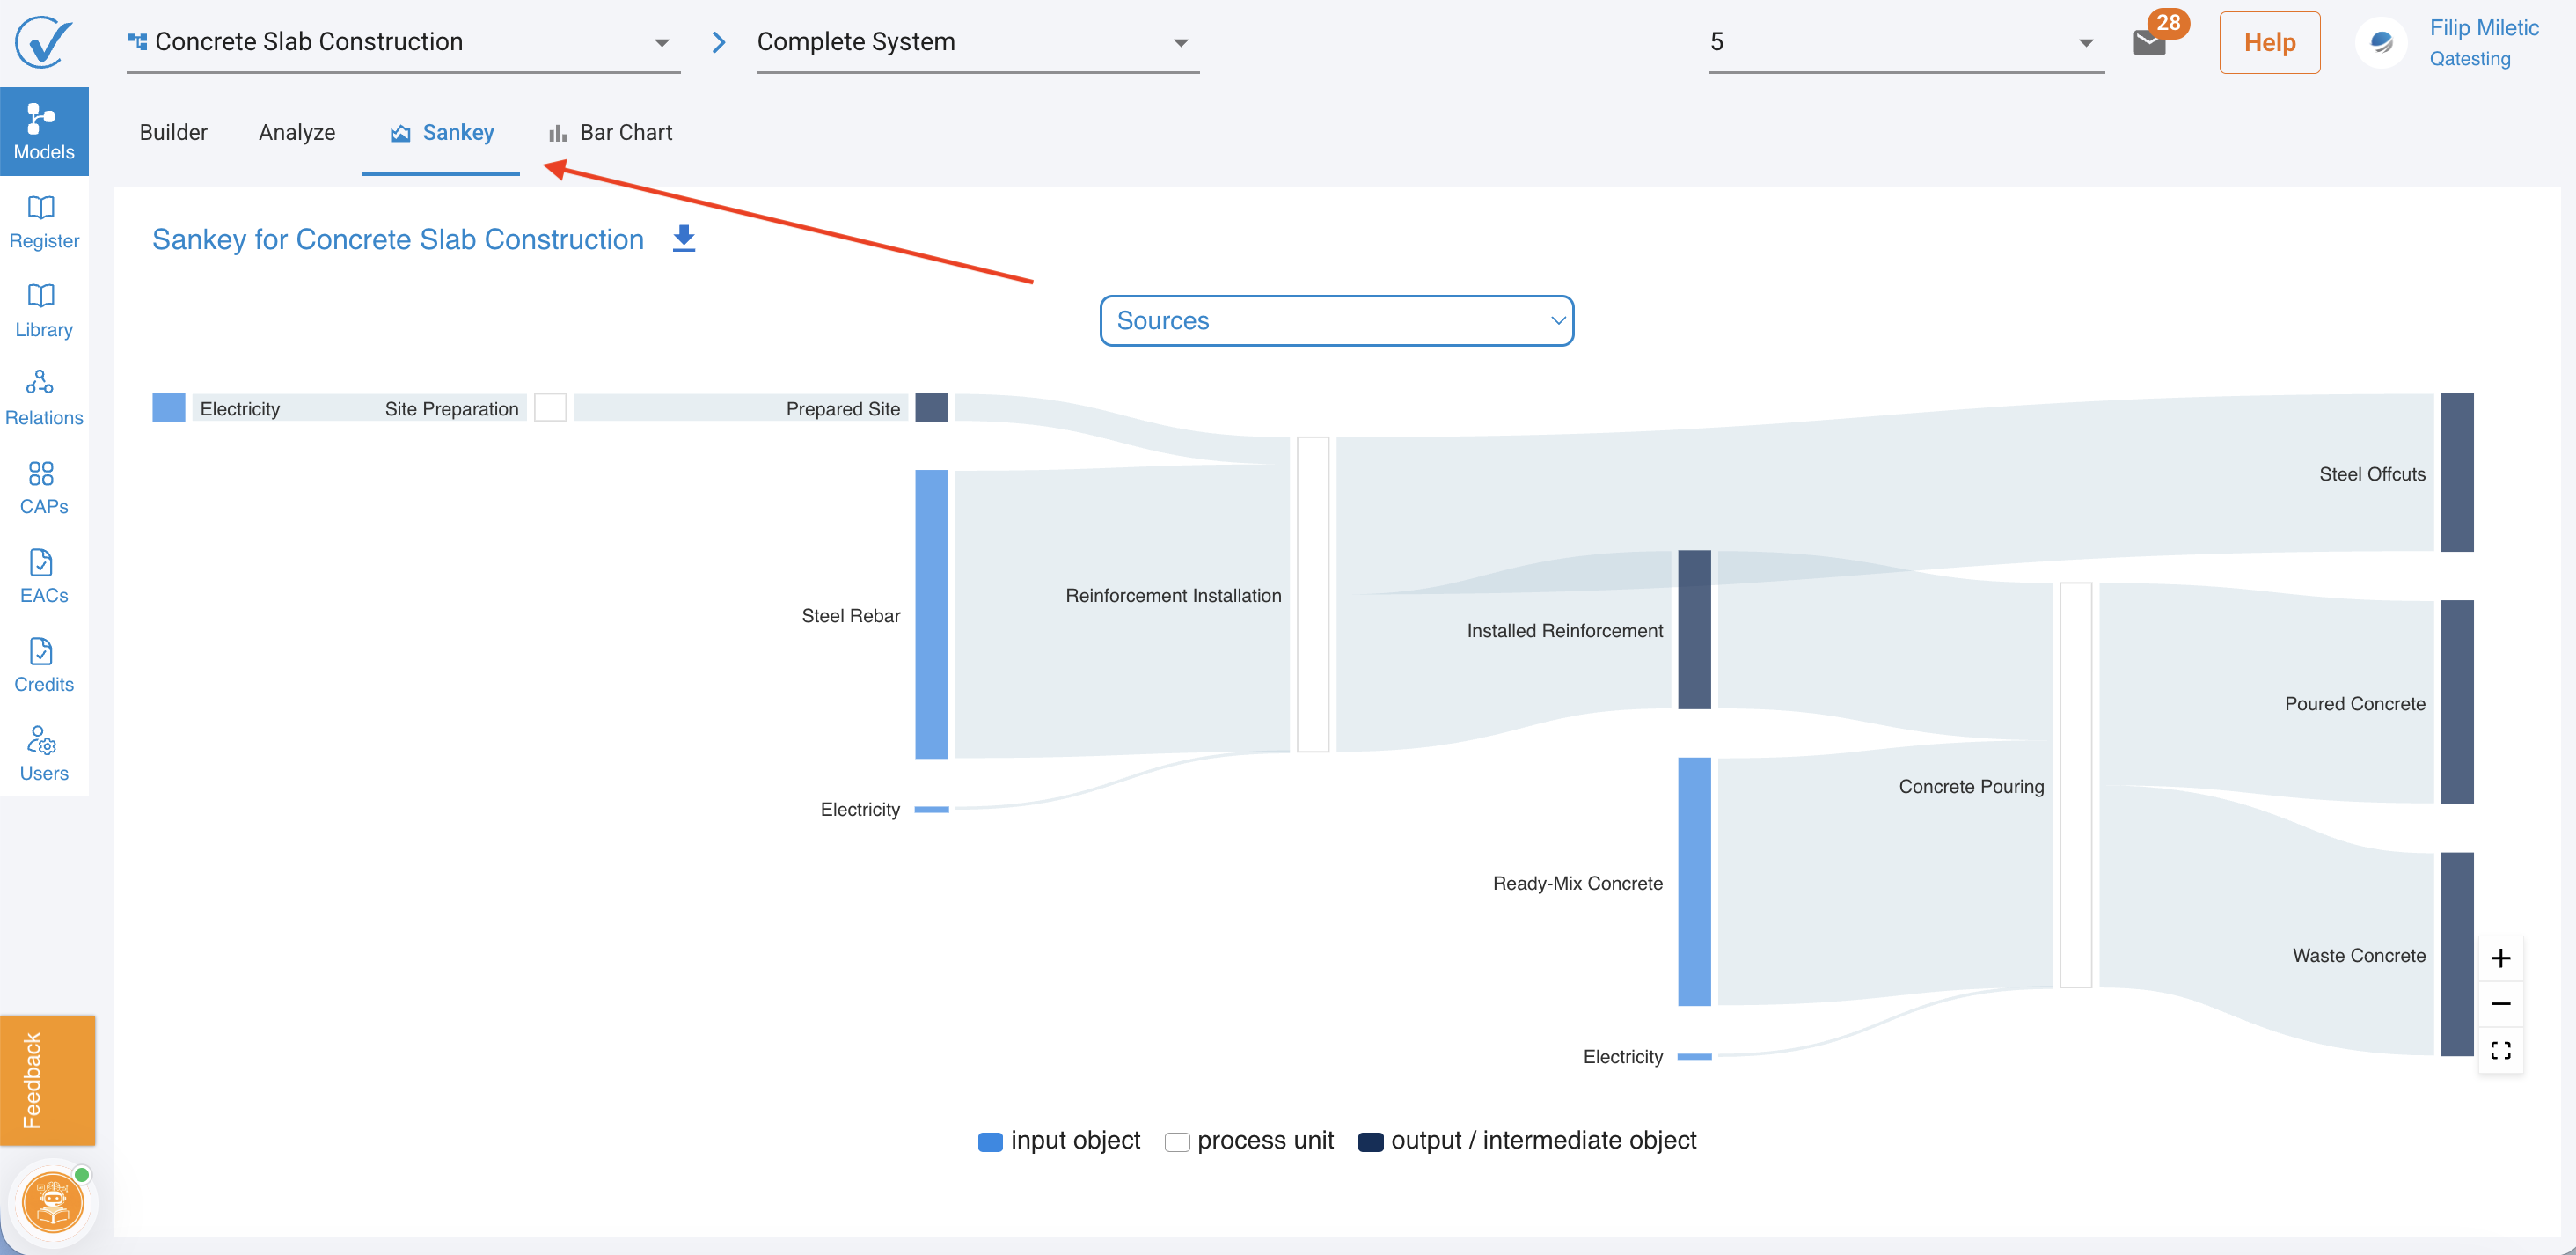
The Sankey diagram visualizes carbon flows through your model, showing how emissions travel from inputs through processes to final outputs.
Understanding the Sankey Diagram
Visual Elements
The Sankey uses three visual components:
| Element | Color | Represents |
|---|---|---|
| Input objects | Light blue | Materials and energy entering processes |
| Process units | Light gray boxes | Activities that transform inputs |
| Output/Intermediate objects | Dark blue/gray | Products and co-products |
Flow width indicates emission magnitude - wider flows = higher emissions
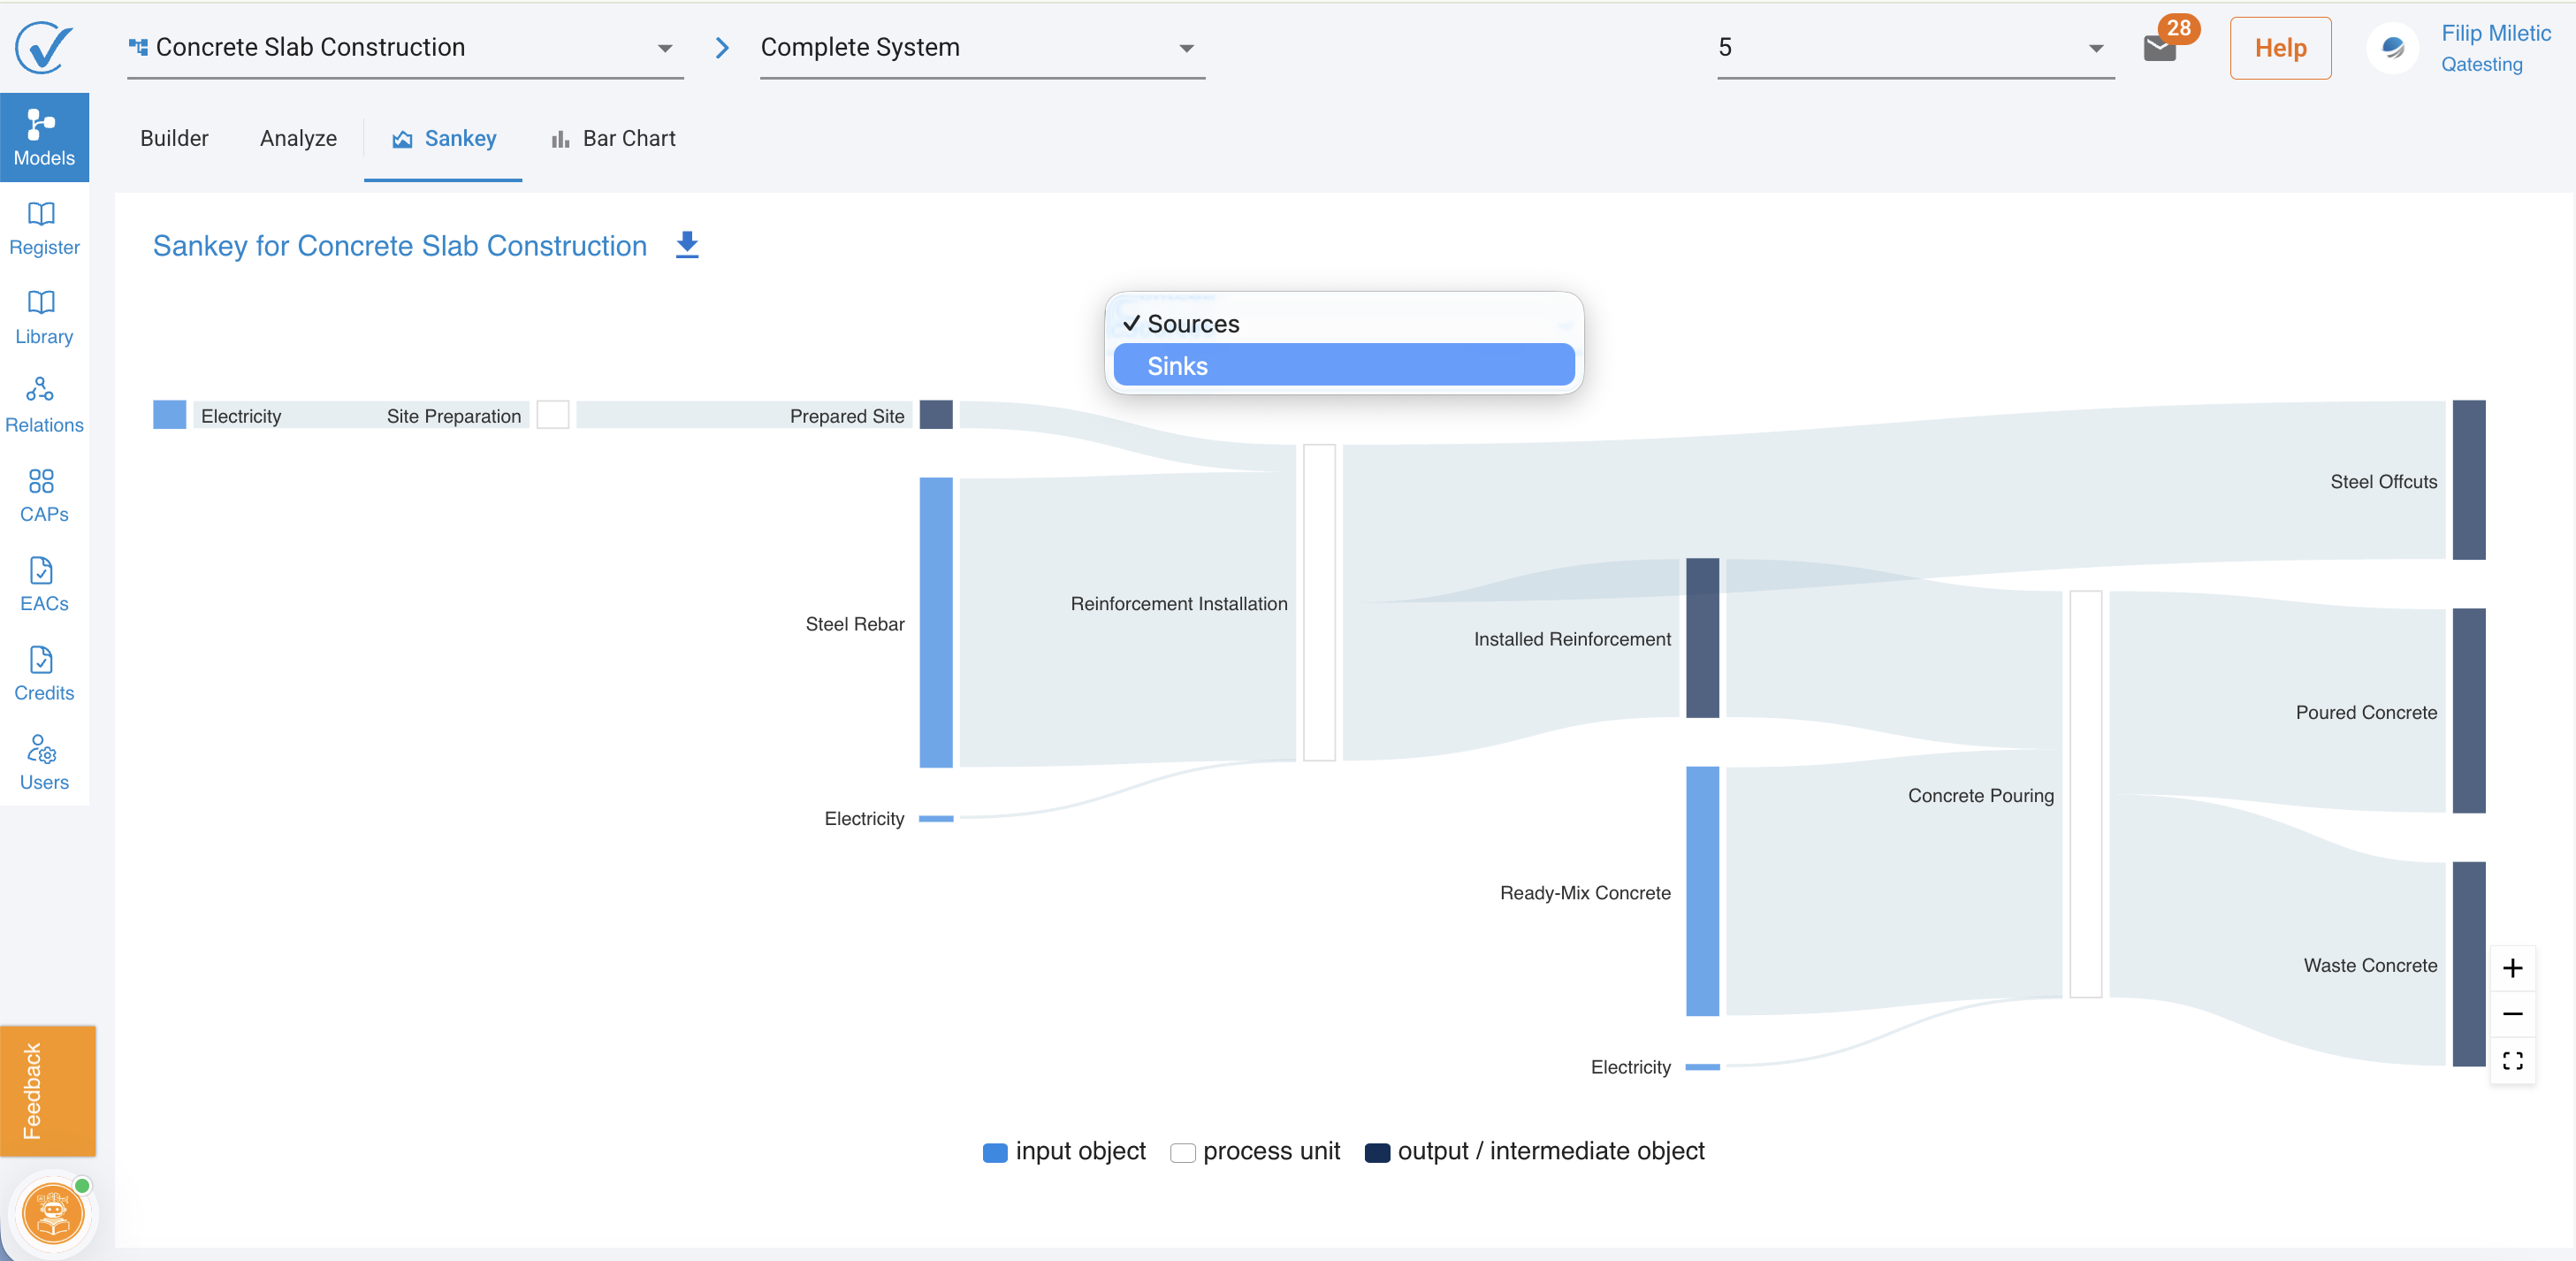
Switching Between Sources and Sinks
Options:
- ✓ Sources (default) - Shows emission generation
- Sinks - Shows carbon removal
Why separate views:
- Carbon flows in opposite directions (emission vs. sequestration)
- Prevents visual overlap and confusion
- Allows focused analysis of each aspect
- Clarifies accounting methodology
💡 Pro tip:
- Review Sources first to identify emission hotspots
- Switch to Sinks to find offset opportunities
- Compare magnitudes to understand net carbon position
Important: Sources and Sinks cannot be displayed simultaneously in the same Sankey diagram.
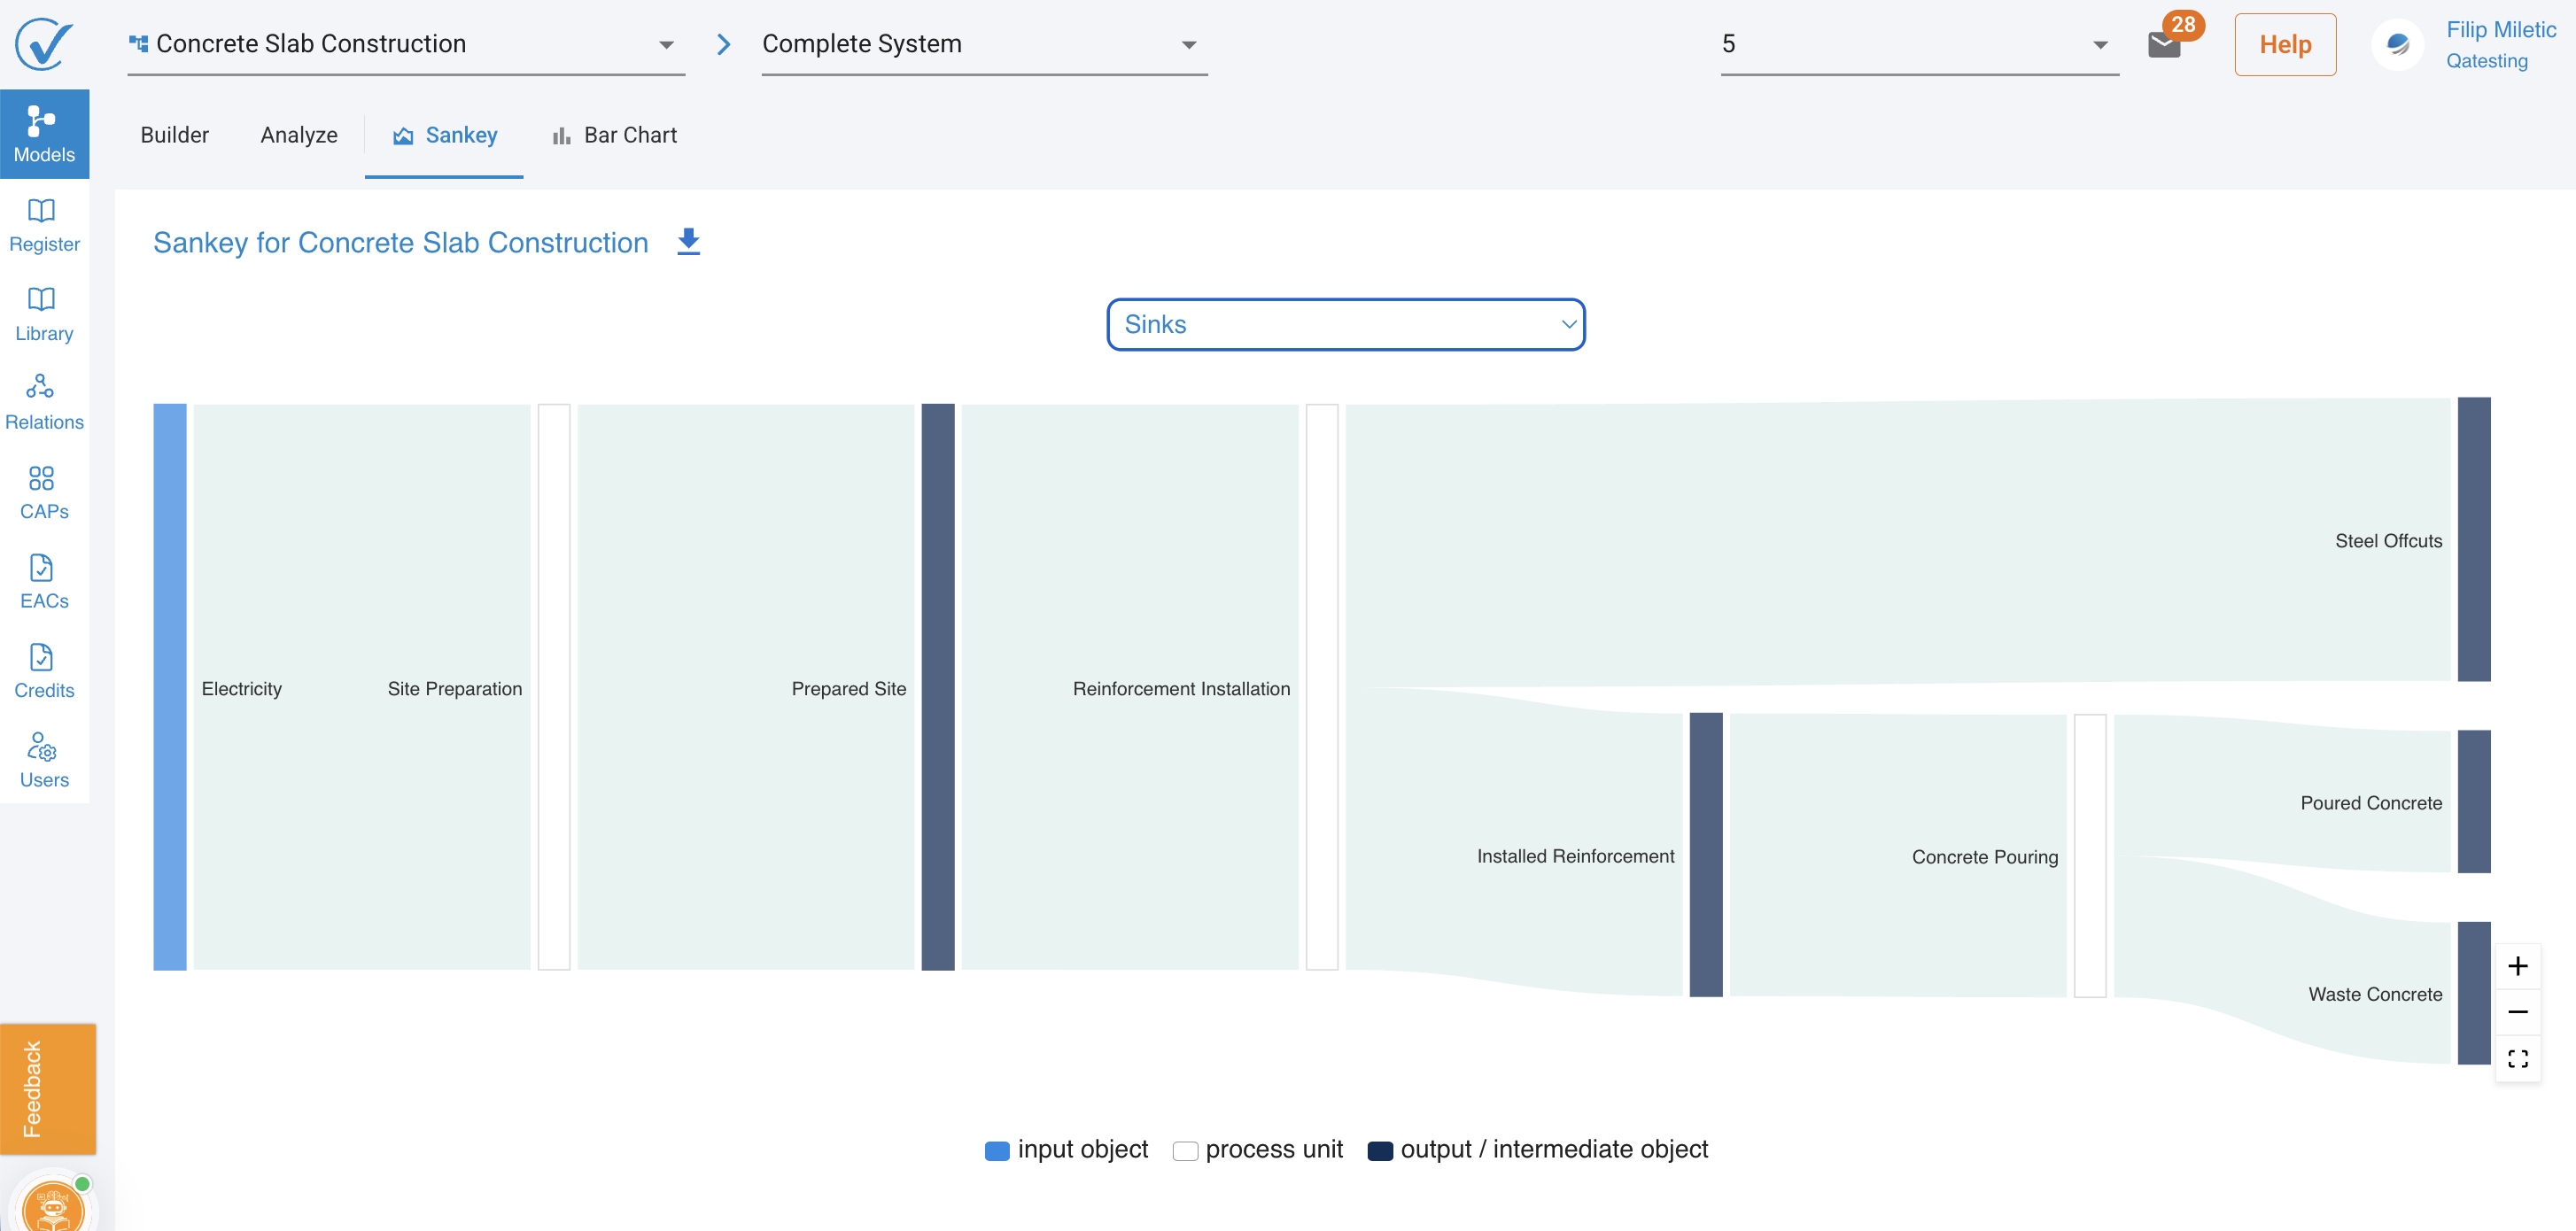
Sources View (Default)
Shows emissions generated by the model:
What you see:
- Blue input flows representing emission sources
- Process units showing transformation steps
- Output products on the right side
- Flow size proportional to CO₂e emissions
Example from Concrete Slab Construction:
- Electricity (light blue) → Site Preparation → Prepared Site
- Steel Rebar (large blue flow) → Reinforcement Installation → Installed Reinforcement
- Ready-Mix Concrete (large blue flow) → Concrete Pouring → Poured Concrete
- Electricity (small flows) → Various processes
💡 Reading the diagram:
- Larger flows indicate higher-emission inputs
- Multiple processes show model complexity
- Final outputs (right side) show product destinations
Sinks View
Shows carbon removed or sequestered by the model:
To switch to Sinks view:
- Look for the dropdown menu above the diagram
- Click to expand (shows "✓ Sources" with "Sinks" below)
- Select "Sinks"
What changes:
- Flow colors shift to show carbon removal
- Only processes with carbon sinks display flows
- Diagram simplifies to show sequestration pathways
- Flow sizes represent carbon removed (kg CO₂e)
Example from Concrete Slab Construction:
- Electricity (light blue) → Site Preparation (shows minimal sink activity)
- Most processes show no sink flows (indicated by empty/light gray areas)
- Installed Reinforcement → Shows significant carbon sequestration (large teal flow)
- Final outputs reflect net carbon removal benefits
Why Sinks are separate:
- Sources and Sinks flow in opposite directions (emission vs. removal)
- Combining would create visual confusion
- Separate views clarify carbon accounting methodology
- Allows focused analysis of emissions vs. removal strategies
Sankey Diagram Controls
Zoom and Navigation
Located in bottom-right corner:
| Control | Function |
|---|---|
| + | Zoom in for detail |
| − | Zoom out for overview |
| ⤢ | Reset to default view |
💡 Tip: Zoom in to read small process labels or analyze minor flows
Interpreting Flow Patterns
Bottleneck Identification
Wide flows entering processes = High-emission inputs
- Steel Rebar → Reinforcement Installation (largest blue flow)
- Ready-Mix Concrete → Concrete Pouring (second largest flow)
Action: Focus reduction efforts on these major contributors
Process Complexity
Multiple converging flows = Complex processes with many inputs
- Concrete Pouring receives Ready-Mix Concrete + Electricity
- Shows interdependency of materials and energy
Action: Consider process efficiency improvements
Parallel Pathways
Multiple processes operating simultaneously:
- Site Preparation happens while Reinforcement Installation proceeds
- Shows model parallelization
Action: Optimize scheduling to reduce peak emissions
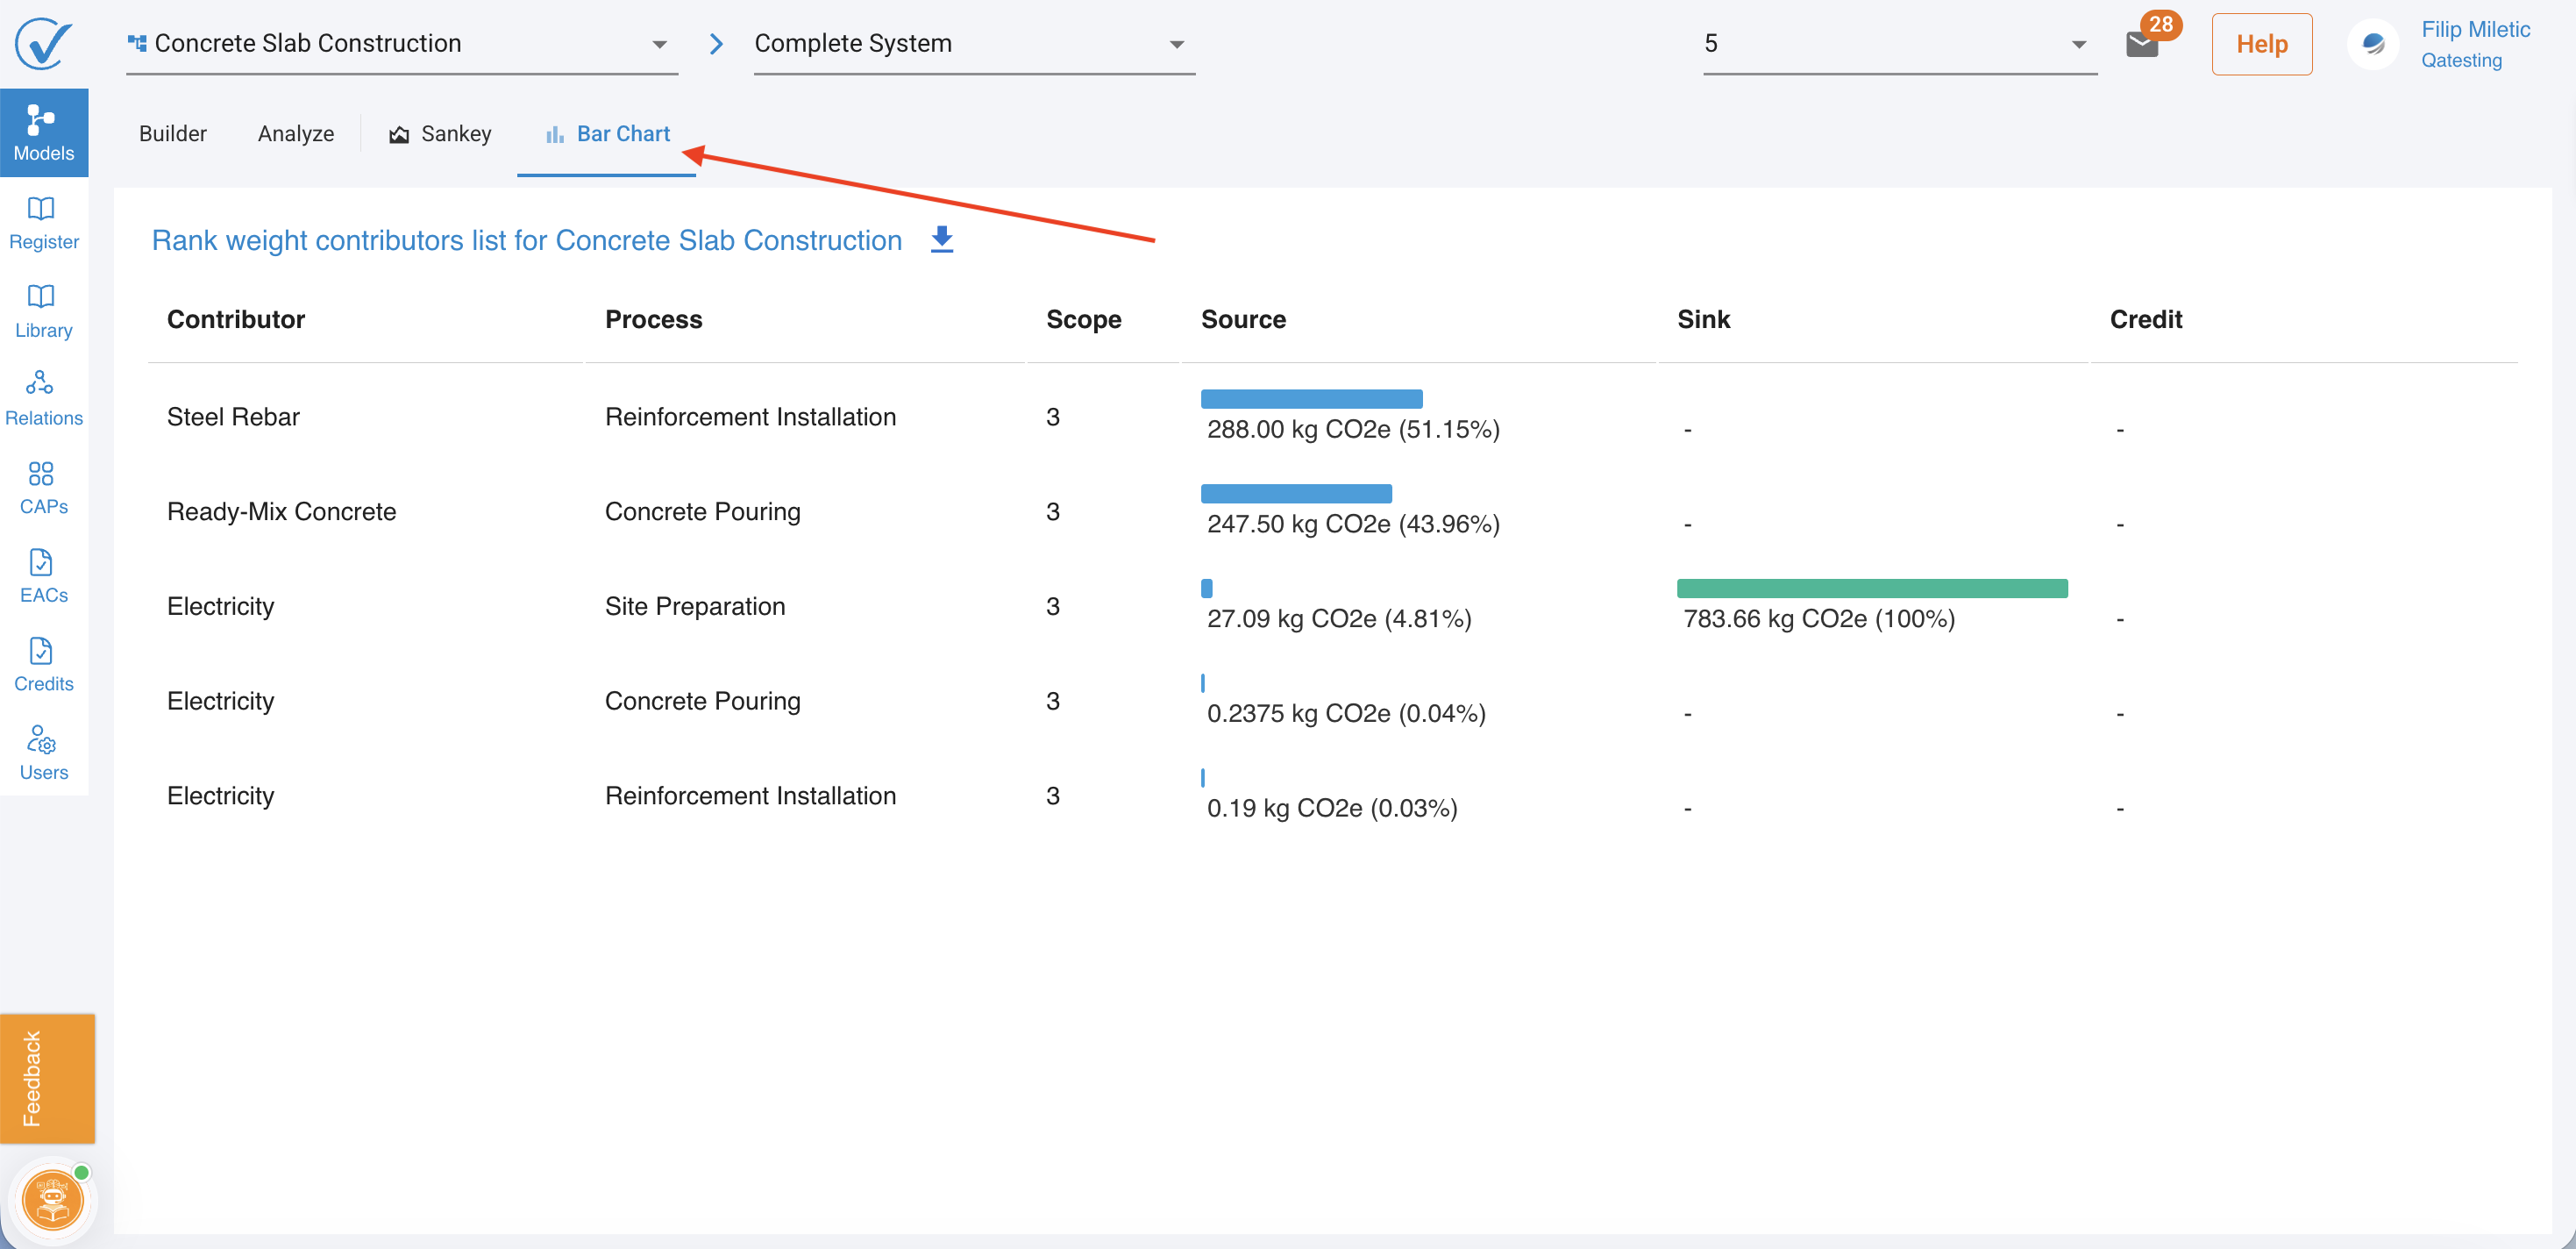
Bar Chart View
The Bar Chart ranks contributors by emission magnitude, making it easy to identify hotspots.
Understanding the Bar Chart
Column Definitions
| Column | What It Shows | Example |
|---|---|---|
| Contributor | Input or material name | "Steel Rebar", "Ready-Mix Concrete" |
| Process | Where the contributor is used | "Reinforcement Installation", "Concrete Pouring" |
| Scope | Emission scope classification | 3 (upstream supply chain) |
| Source (kg CO₂e) | Emissions generated | 288.00 kg CO₂e (51.15%) |
| Sink (kg CO₂e) | Carbon removed | 783.66 kg CO₂e (100%) |
| Credit (kg CO₂e) | Offsets applied | - (none in this example) |
Reading the Visualizations
Horizontal Bars
Bar length = Contribution magnitude
- Longer bars = Higher emissions or greater carbon removal
- Percentage shows relative contribution to total
Color coding:
- Blue bars = Sources (emissions)
- Green bars = Sinks (carbon removal)
- Orange/empty = Credits (when applied)
Example Rankings:
Top Sources (Emissions):
- Steel Rebar → Reinforcement Installation
- 288.00 kg CO₂e (51.15%)
- Largest emission contributor
- Ready-Mix Concrete → Concrete Pouring
- 247.50 kg CO₂e (43.96%)
- Second largest contributor
- Electricity → Site Preparation
- 27.09 kg CO₂e (4.81%)
- Minor but consistent contributor
- Electricity → Concrete Pouring
- 0.2375 kg CO₂e (0.04%)
- Negligible impact
- Electricity → Reinforcement Installation
- 0.19 kg CO₂e (0.03%)
- Minimal contribution
Sink Analysis (Bar Chart)
When viewing sinks in the bar chart:
Example from the data:
- Electricity → Site Preparation
- Sink: 783.66 kg CO₂e (100%)
- Shows complete carbon offset for this process
- Likely due to renewable energy credits or avoided emissions
Why only one sink shows:
- Most processes in this example generate net emissions
- Only Site Preparation electricity has associated carbon removal
- Demonstrates selective application of green energy
Using Bar Chart for Decision-Making
Identify Top 3 Contributors
The 80/20 Rule: Top 2-3 contributors typically represent 80%+ of emissions
From the example:
- Steel Rebar (51.15%) + Ready-Mix Concrete (43.96%) = 95.11% of emissions
- Focus reduction efforts here for maximum impact
Scope Distribution Analysis
All contributors show Scope 3:
- Indicates upstream supply chain emissions dominate
- Direct process emissions (Scope 1) are minimal
- Purchased energy (Scope 2) is negligible
Action: Engage suppliers to reduce embodied carbon in materials
Minor Contributors
Contributors < 1% of total:
- Electricity inputs (0.04%, 0.03%)
- May not warrant immediate attention
- Focus on major sources first
Comparing Sources vs. Sinks
In Sankey Diagrams
Sources view:
- Shows complete emission pathways
- Identifies where carbon enters the model
- Helps trace emissions to origin
Sinks view:
- Shows carbon removal pathways
- Highlights offset opportunities
- Demonstrates environmental benefits
💡 Tip: Review both views to understand net carbon position
In Bar Charts
Simultaneous display:
- Sources and Sinks appear in same table
- Side-by-side comparison of generation vs. removal
- Percentage helps prioritize actions
Key insight from example:
- Source: 288.00 kg (51.15%) from Steel Rebar
- Sink: 783.66 kg (100%) from Site Preparation electricity
- Net effect depends on full model calculation
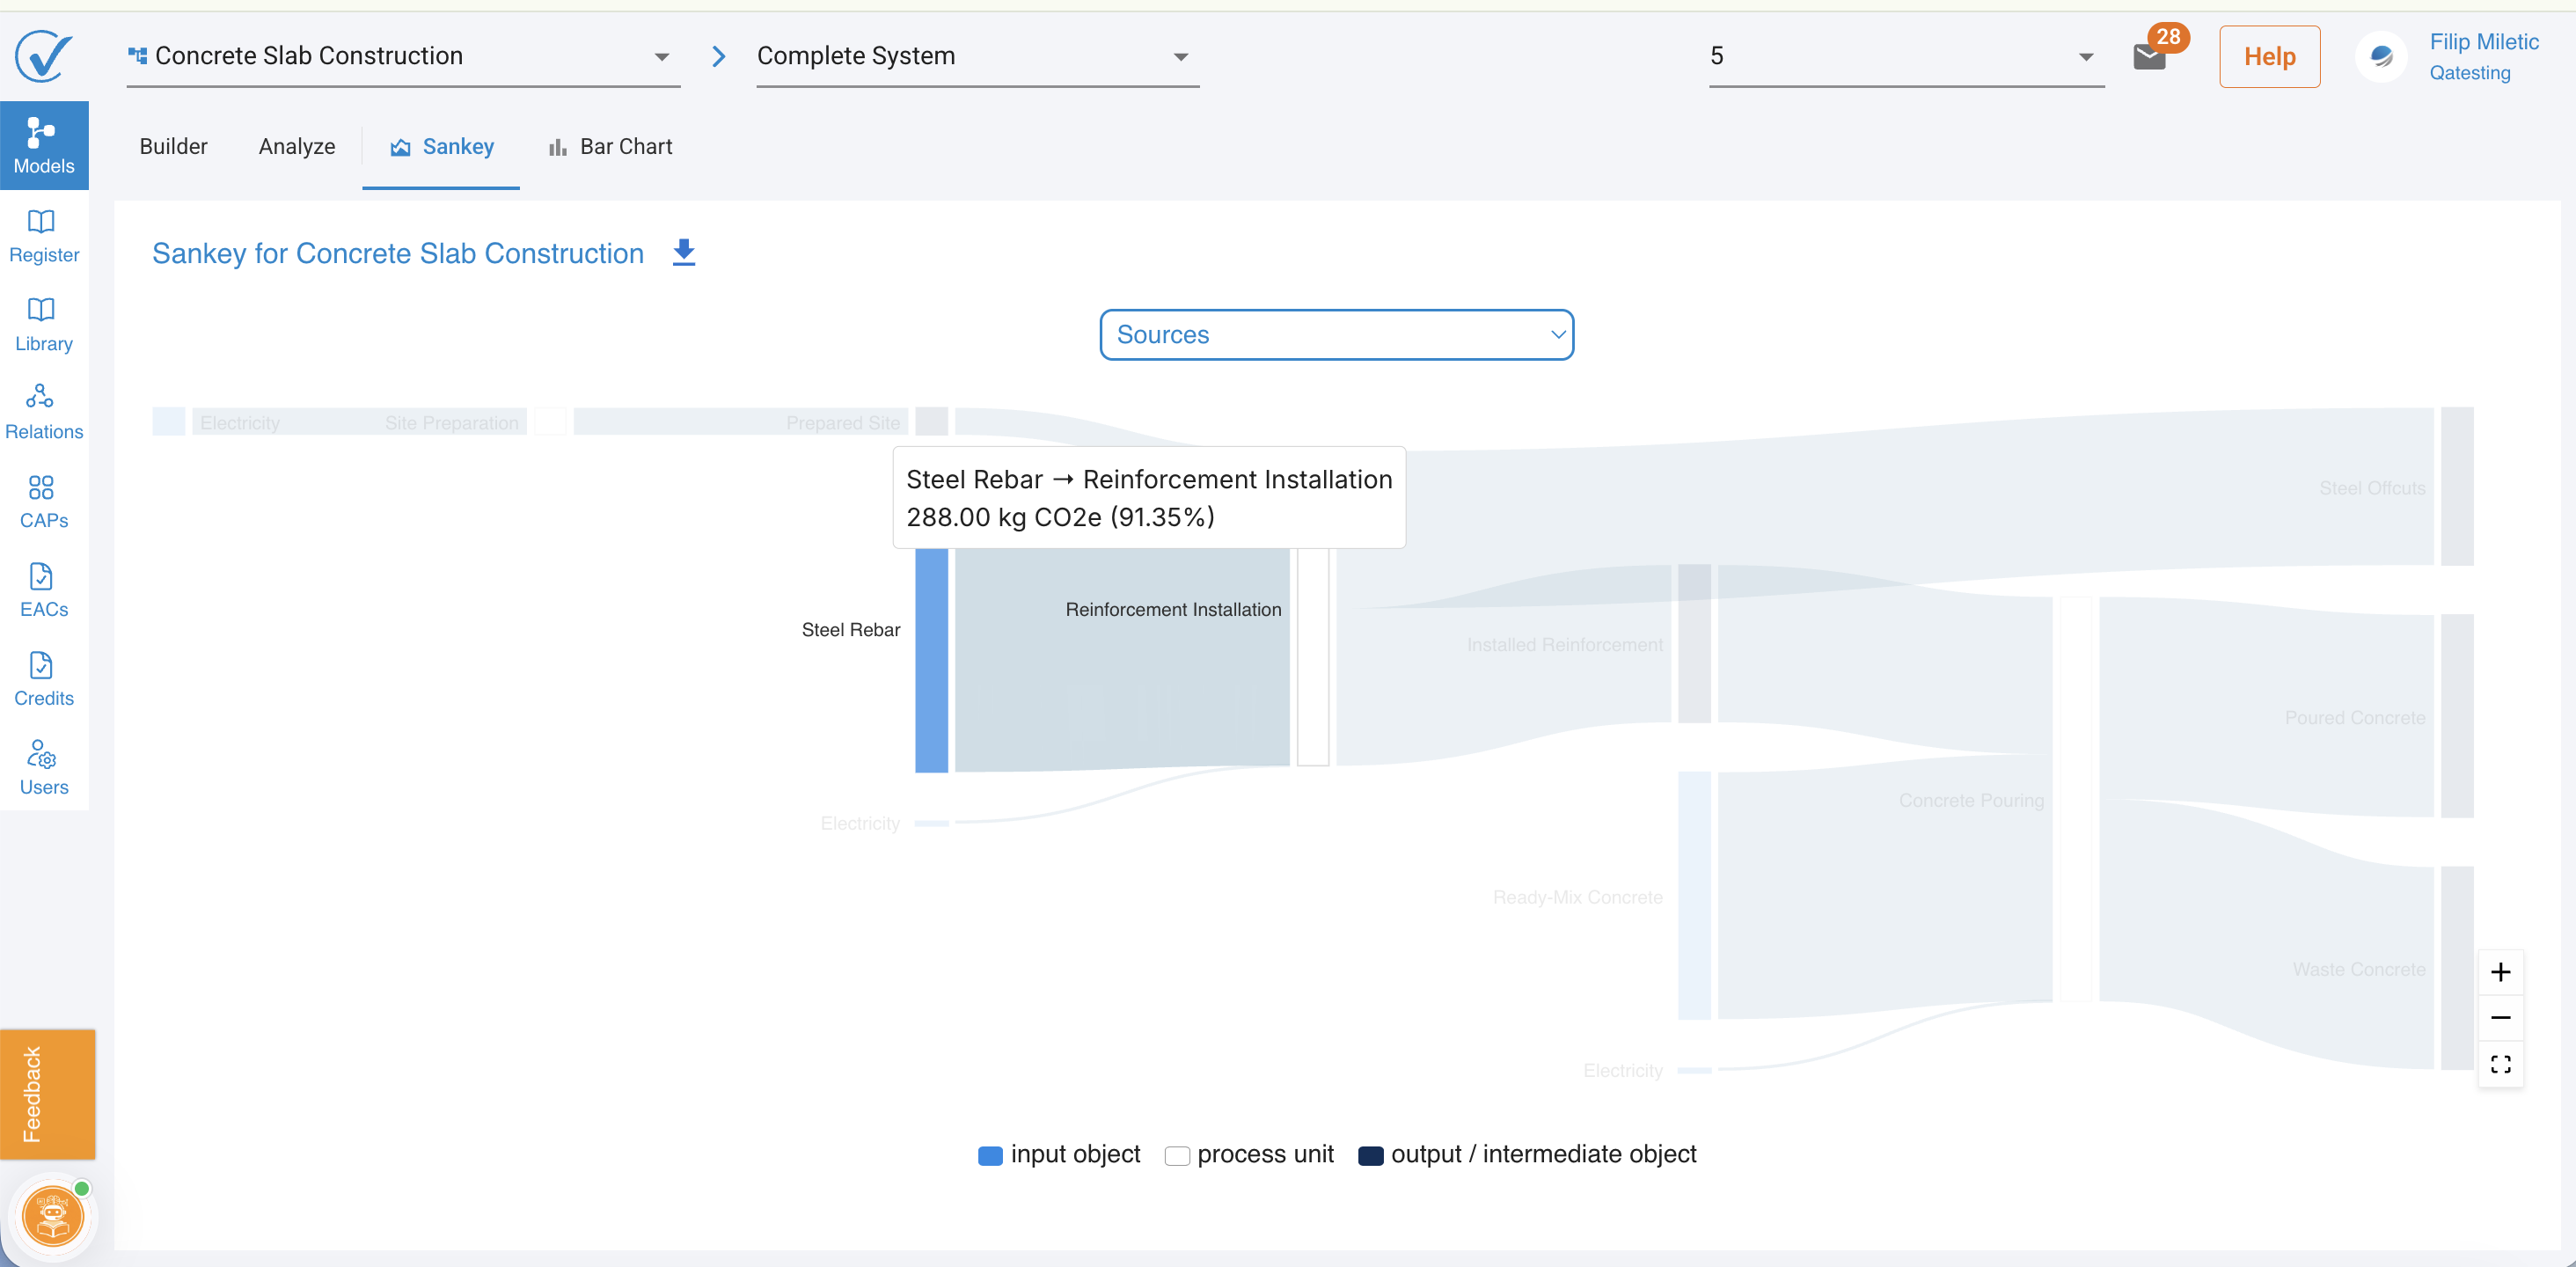
Interactive Features
Hover Details (Sankey)
Mouse over elements to see:
- Exact emission values (kg CO₂e)
- Contributor names
- Process connections
- Flow magnitudes
💡 Tip: Hover to verify visual interpretations with precise data
Visualization Best Practices
When to Use Sankey
Best for:
- Understanding model structure and flow logic
- Identifying process relationships
- Communicating with stakeholders visually
- Presenting complete life cycle flows
- Finding process bottlenecks
Example use case:
- "Show management where emissions originate and flow through our model"
When to Use Bar Chart
Best for:
- Quick identification of top contributors
- Prioritizing reduction efforts
- Data-driven decision making
- Comparing contributor magnitudes
- Detailed numerical analysis
Example use case:
- "Which 3 inputs should we focus on to reduce 80% of emissions?"
Common Patterns and What They Mean
Dominant Single Contributor
Pattern: One bar represents >50% of emissions
- Example: Steel Rebar at 51.15%
- Meaning: Single-material dependency
- Action: Investigate lower-carbon steel alternatives or reduce quantities
Balanced Distribution
Pattern: Multiple contributors at 20-30% each
- Meaning: Model complexity with no clear hotspot
- Action: Holistic approach needed; optimize multiple areas
Long Tail of Small Contributors
Pattern: Many inputs each <5%
- Example: Multiple electricity entries at <1%
- Meaning: Process energy efficiency already optimized
- Action: Focus on material selection instead
Exporting Visualizations
Screenshots for Reports
Recommended workflow:
- Set Sankey zoom to optimal level
- Capture full-screen view
- Toggle to Sinks view and capture
- Capture full-screen view for Bar Chart data
- Use in presentations and reports
💡 Tip: Include both Sources and Sinks Sankey views in reports to show complete carbon story
Troubleshooting Visualizations
Sankey diagram not displaying:
- Verify model has "Ready" status
- Check that all processes have connections
- Ensure inputs have emission data assigned
- Refresh browser
Bar Chart shows unexpected rankings:
- Verify Entry mode data is correct
- Check conversion factors are applied properly
- Review allocation rules in Properties
- Confirm emission sources are appropriate
Empty Sinks view:
- Normal if model has no carbon removal processes
- Check if renewable energy or credits are assigned
- Verify sink data in Entry mode
- Some models legitimately have zero sinks
Zoom controls not working:
- Try browser refresh
- Clear cache
- Check browser compatibility
- Use keyboard shortcuts: Ctrl/Cmd + scroll
Quick Reference: Visualization Actions
| I want to... | Do this... |
|---|---|
| See emission pathways | Results → Sankey → Sources |
| See carbon removal | Results → Sankey → Sinks |
| Find top 3 hotspots | Results → Bar Chart → Review top rows |
| Zoom in on detail | Use + control or mouse wheel |
| Reset view | Click ⤢ (fullscreen) control |
| Compare contributors | Review Bar Chart percentages |
| Trace emissions to source | Follow Sankey flows left to right |
| Identify process complexity | Count converging flows in Sankey |
Next Steps After Analysis
Your results are calculated. Now you can:
- Update data → Switch to Builder mode for refined inputs
- Register system → Move to immutuble state for next steps
- Generate CAPs → Publish products for sharing
- Create reports → Use visualization tools for stakeholders
Troubleshooting
No results showing:
- Check system model status is "Ready"
- Ensure all inputs have data in Builder mode
- Verify calculations completed successfully
- Refresh page
Unexpected values:
- Review Builder mode data for errors
- Check conversion factors are correct
- Verify emission sources are appropriate
- Validate allocation rules in Properties
Can't publish product:
- Ensure you have Admin or Editor role
- Check model is in "Ready" status
- Verify all required data is complete
- Contact support if issue persists
Related: Add Data to Your System | System Status Indicators | Generate CAPs
Last updated: April 2026