
Latest update October '25 - Advanced Analytics & Supplier Intelligence Features
Overview
CarbonSig has introduced four powerful new capabilities designed to provide deeper insights into your carbon accounting operations, enhance transparency in AI-assisted data selection, and streamline supplier relationship management. These features work together to give you comprehensive visibility into platform usage, emission data decisions, and workspace-level analytics.
1. Supplier Licence Tracking (Sub-License Activity)
What It Is
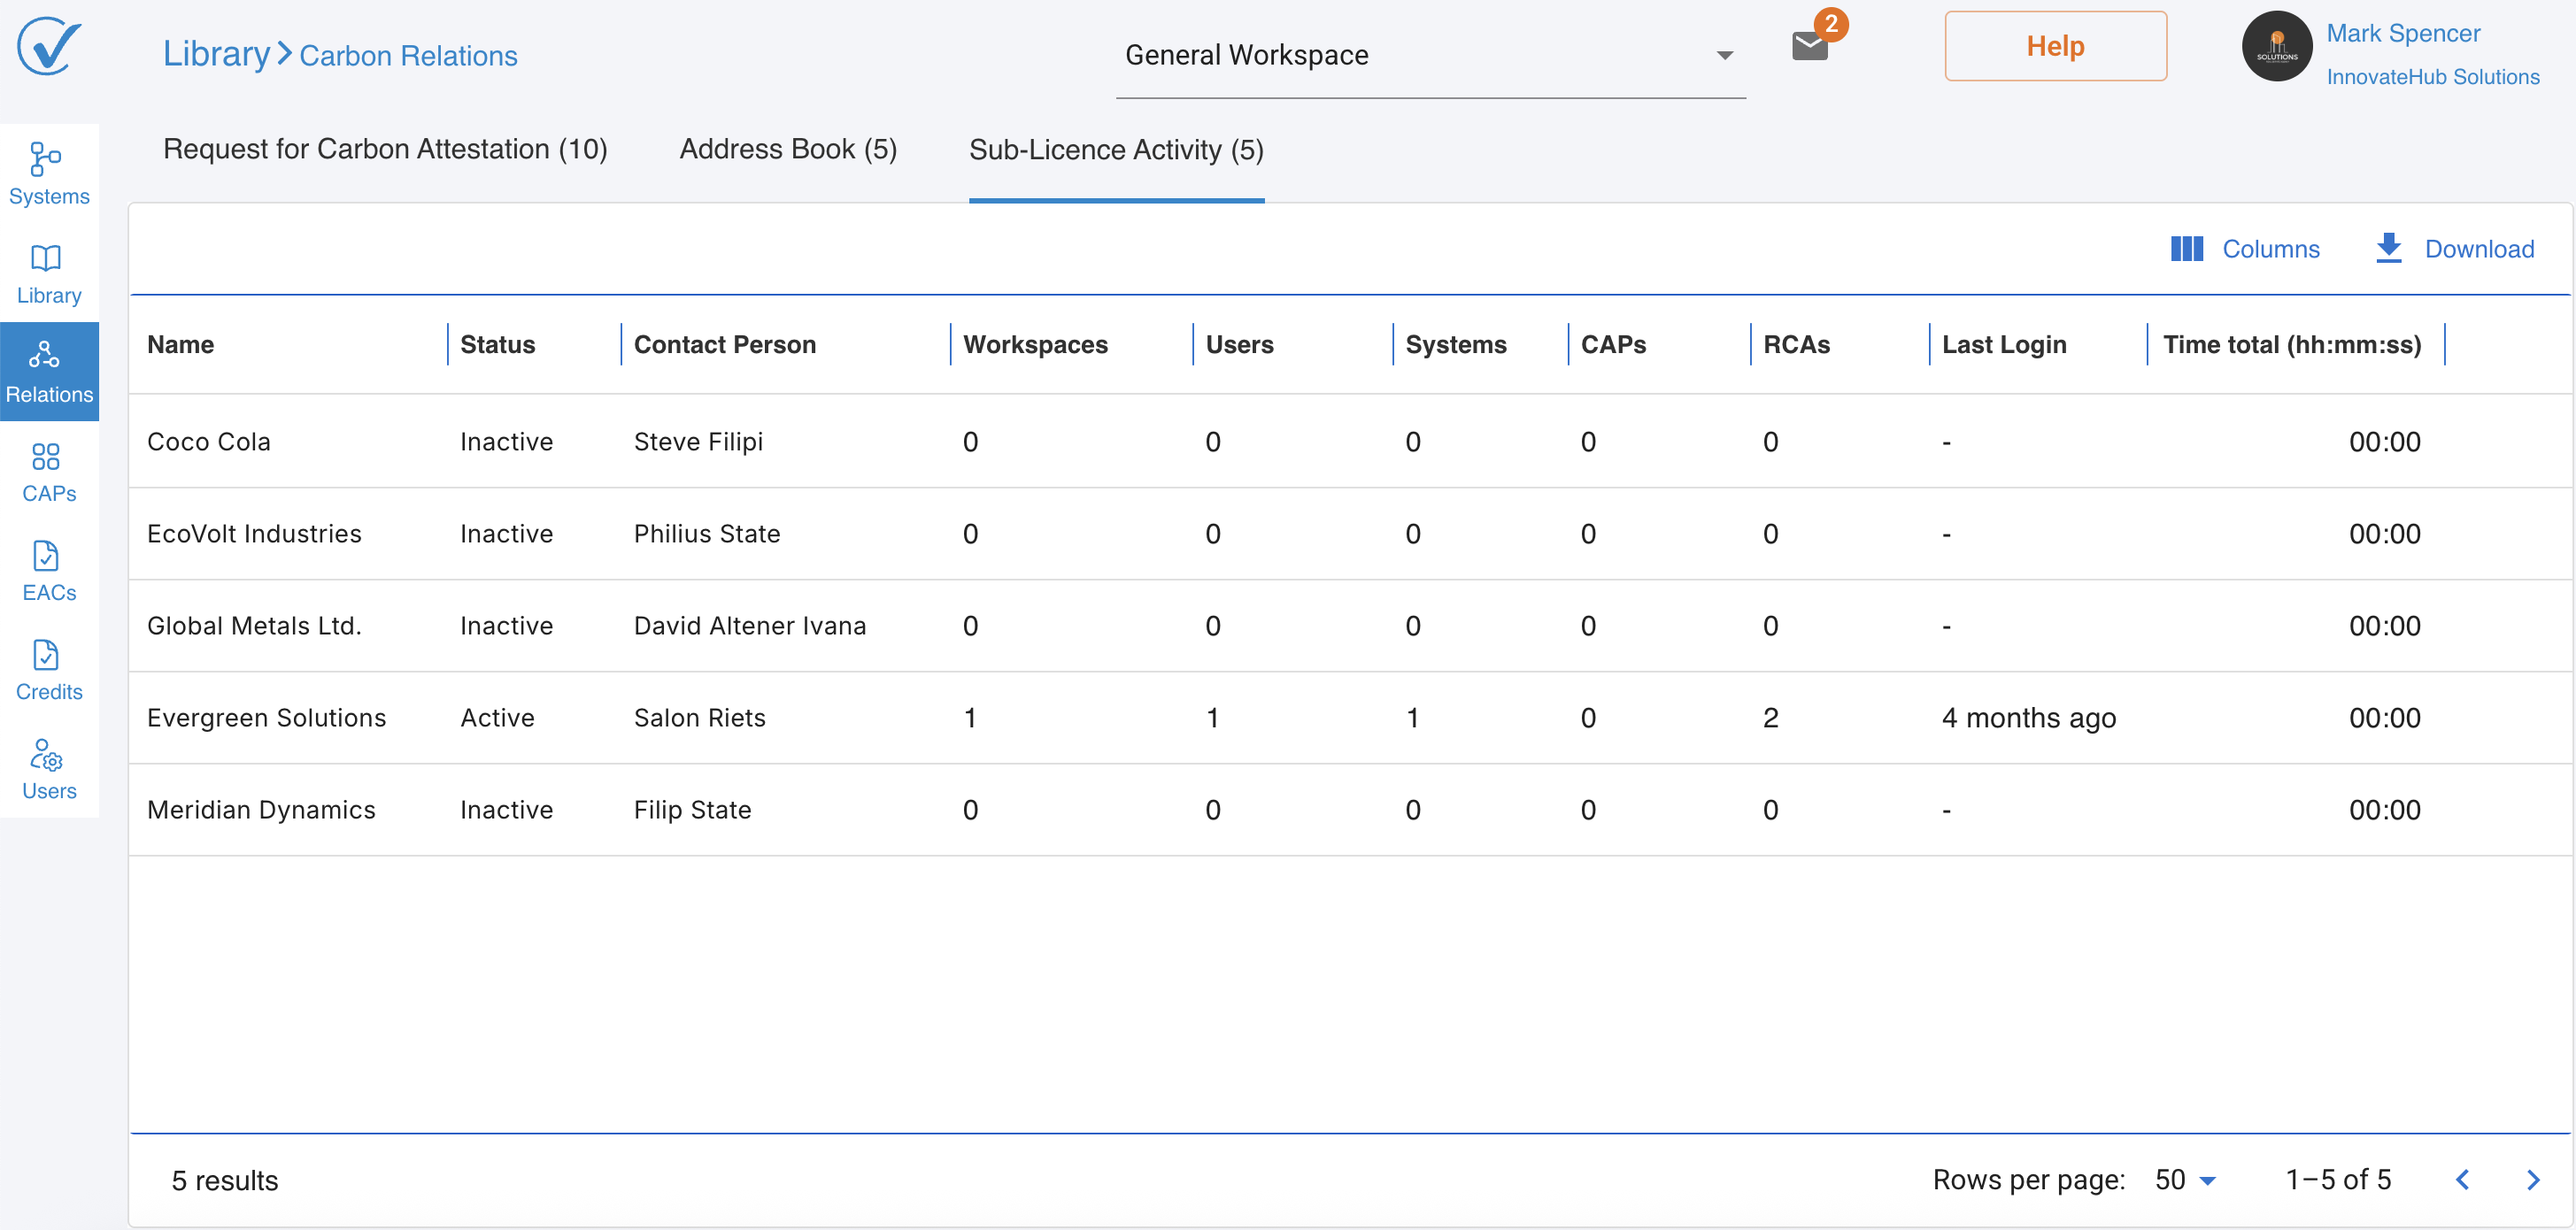
Supplier Licence Tracking provides enterprise accounts with comprehensive insights into supplier activity and resource utilization. This feature, accessible through the Relations page under a new "Sub-License Activity" tab, enables you to monitor supplier engagement, track content creation, and analyze usage patterns across your supplier network.
Business Value
This capability enables you to:
- Monitor supplier engagement levels in real-time
- Track resource utilization across supplier accounts
- Analyze content creation patterns and productivity
- Make data-driven decisions about supplier relationships
- Optimize platform usage and identify training opportunities
How It Works
Access Point: Relations page → Sub-License Activity tab (NEW)
When you send requests from the RFCA (Request for Carbon Attestation) tab, supplier account information automatically appears in the Sub-License Activity view. Each row represents an account, with all metrics aggregated at the account level.
Important: The Address Book and Sub-License Activity information remain synchronized—changes to contact details in the Address Book (Name, Contact Person) are automatically reflected in the Sub-License Activity view.
Available Metrics
Workspaces Count
- What it tracks: Total number of active workspaces created by the supplier account
- Excludes: Training workspaces and archived workspaces
- Updates: Real-time (counter decreases when workspace is archived)
Users Count
- What it tracks: Comprehensive user count including Active and Pending users
- Excludes: Suspended users
- Updates: Real-time (counter decreases when user is suspended)
System Templates Count
- What it tracks: Count of system templates created by any user within the account
- Includes: Systems created from scratch, copied systems, and systems built with AI
Published CAPs Count
- What it tracks: Total number of Carbon Attested Products (CAPs) published by the account
- Includes: Successfully published CAPs, transferred CAPs, and archived CAPs
Number of Sent Requests
- What it tracks: Total count of all requests sent to the supplier account
- Includes: All request types (Sent, Confirmed, Declined, Revoked, Completed)
- Updates: Real-time as new requests are sent
Last Login
- What it tracks: Timestamp of the most recent login by any user within the supplier account
- Display format: Date/Time in your local time zone
- Updates: Real-time upon user authentication
- Shows: "Never" for accounts with no login history
User Activity Time
- Active time tracking (user interactions, clicks, keyboard input)
User Journey
- Populate Address Book with supplier contacts
- Send requests from the RFCA tab to new or existing suppliers
- Automatic tracking begins—supplier information appears in Sub-License Activity tab
- Monitor metrics at the account level for all supplier activity
- Synchronized updates ensure consistency between Address Book and activity tracking
Best Practices
- Regular Monitoring: Review supplier activity metrics weekly to identify engagement patterns
- Proactive Support: Use Last Login and activity metrics to identify suppliers who may need assistance
- Resource Optimization: Analyze system template counts to understand which suppliers are actively using the platform
- Relationship Management: Track request status to ensure timely follow-up with suppliers
2. AI LCI Explanation Report ("Why This LCI?")
What It Is
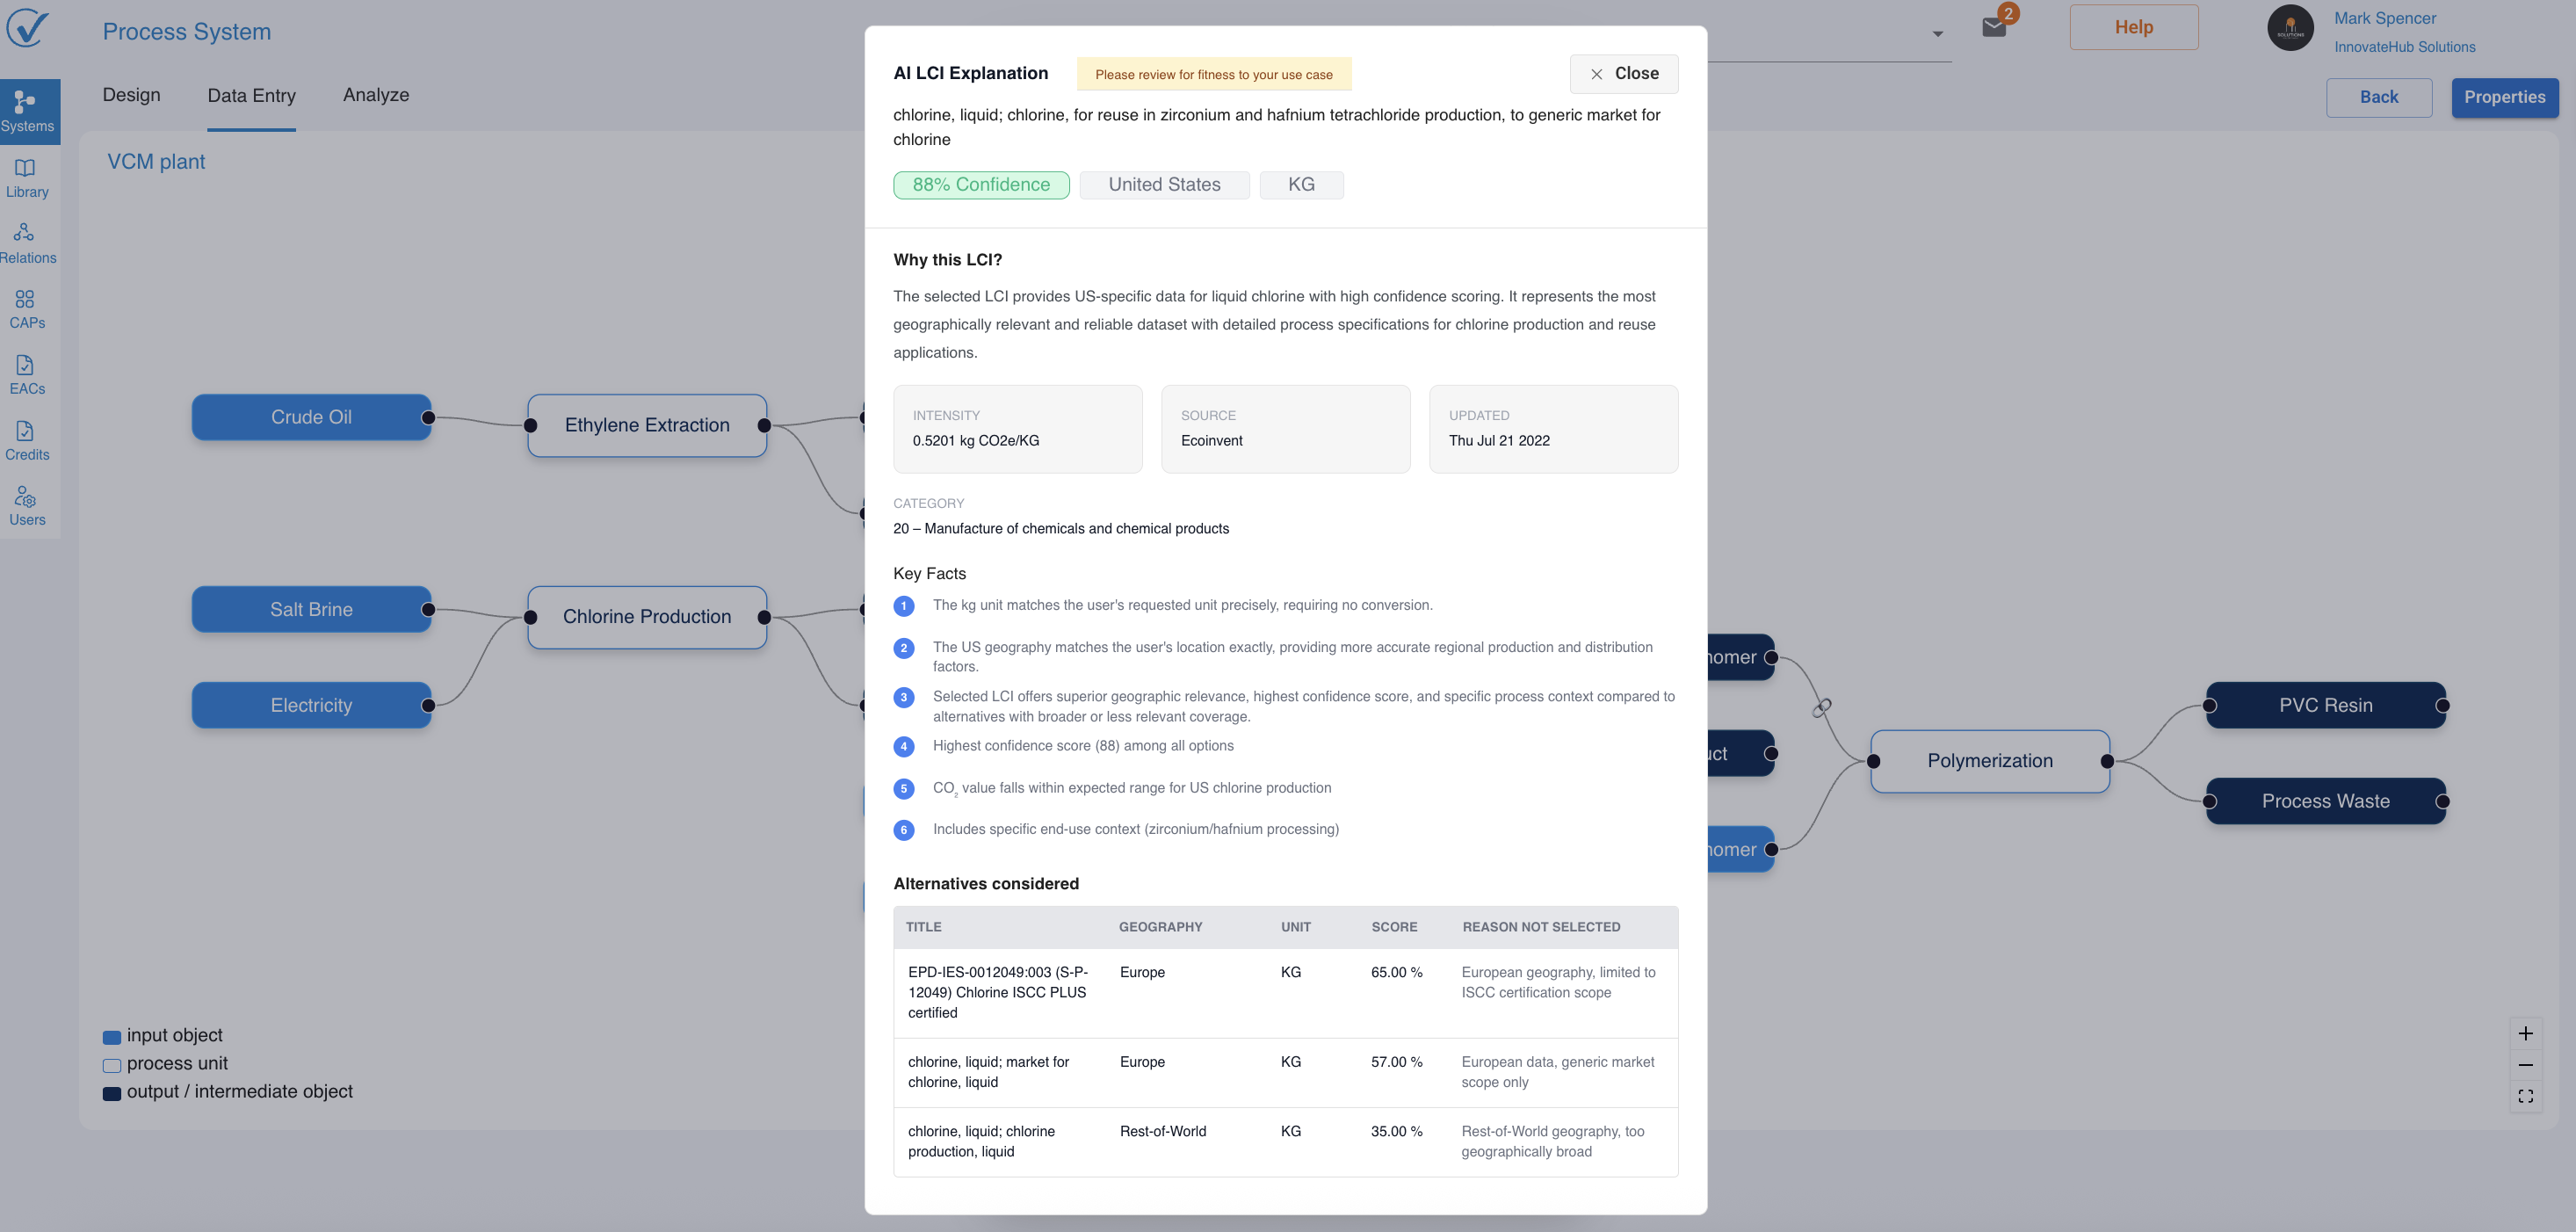
The AI LCI Explanation Report provides transparent, auditable explanations for why the AI selected specific Life Cycle Inventory (LCI) datasets for your inputs. This feature enhances trust and enables faster validation of AI-suggested emission data.
Why It Matters
When you use AI-suggested LCI data in your carbon calculations, understanding the selection rationale is critical for:
- Transparency: Clear visibility into AI decision-making
- Trust building: Confidence in AI recommendations
- Faster validation: Quick acceptance or override decisions
- Audit compliance: Documentation for verification purposes
How the AI Search Works
When you request LCI suggestions, the system:
- Generates embeddings from your search query (input name + notes + uploaded documents)
- Performs semantic search in the Global Reference Library (Ecoinvent, EPD, IPCC, US EPA)
- Scores confidence and prioritizes by geography and data freshness
- Returns top matches (0-5 entries) formatted with confidence levels
The system applies these ranking criteria:
- Name match (exact and fuzzy search with synonyms)
- Country/geography match (prioritizes exact matches)
- Data source (prioritizes Global reference databases)
- Data freshness and attestation quality
How to Access the Explanation
Entry Point: Input Modal → AI-suggested LCI row → "Why This LCI?" button
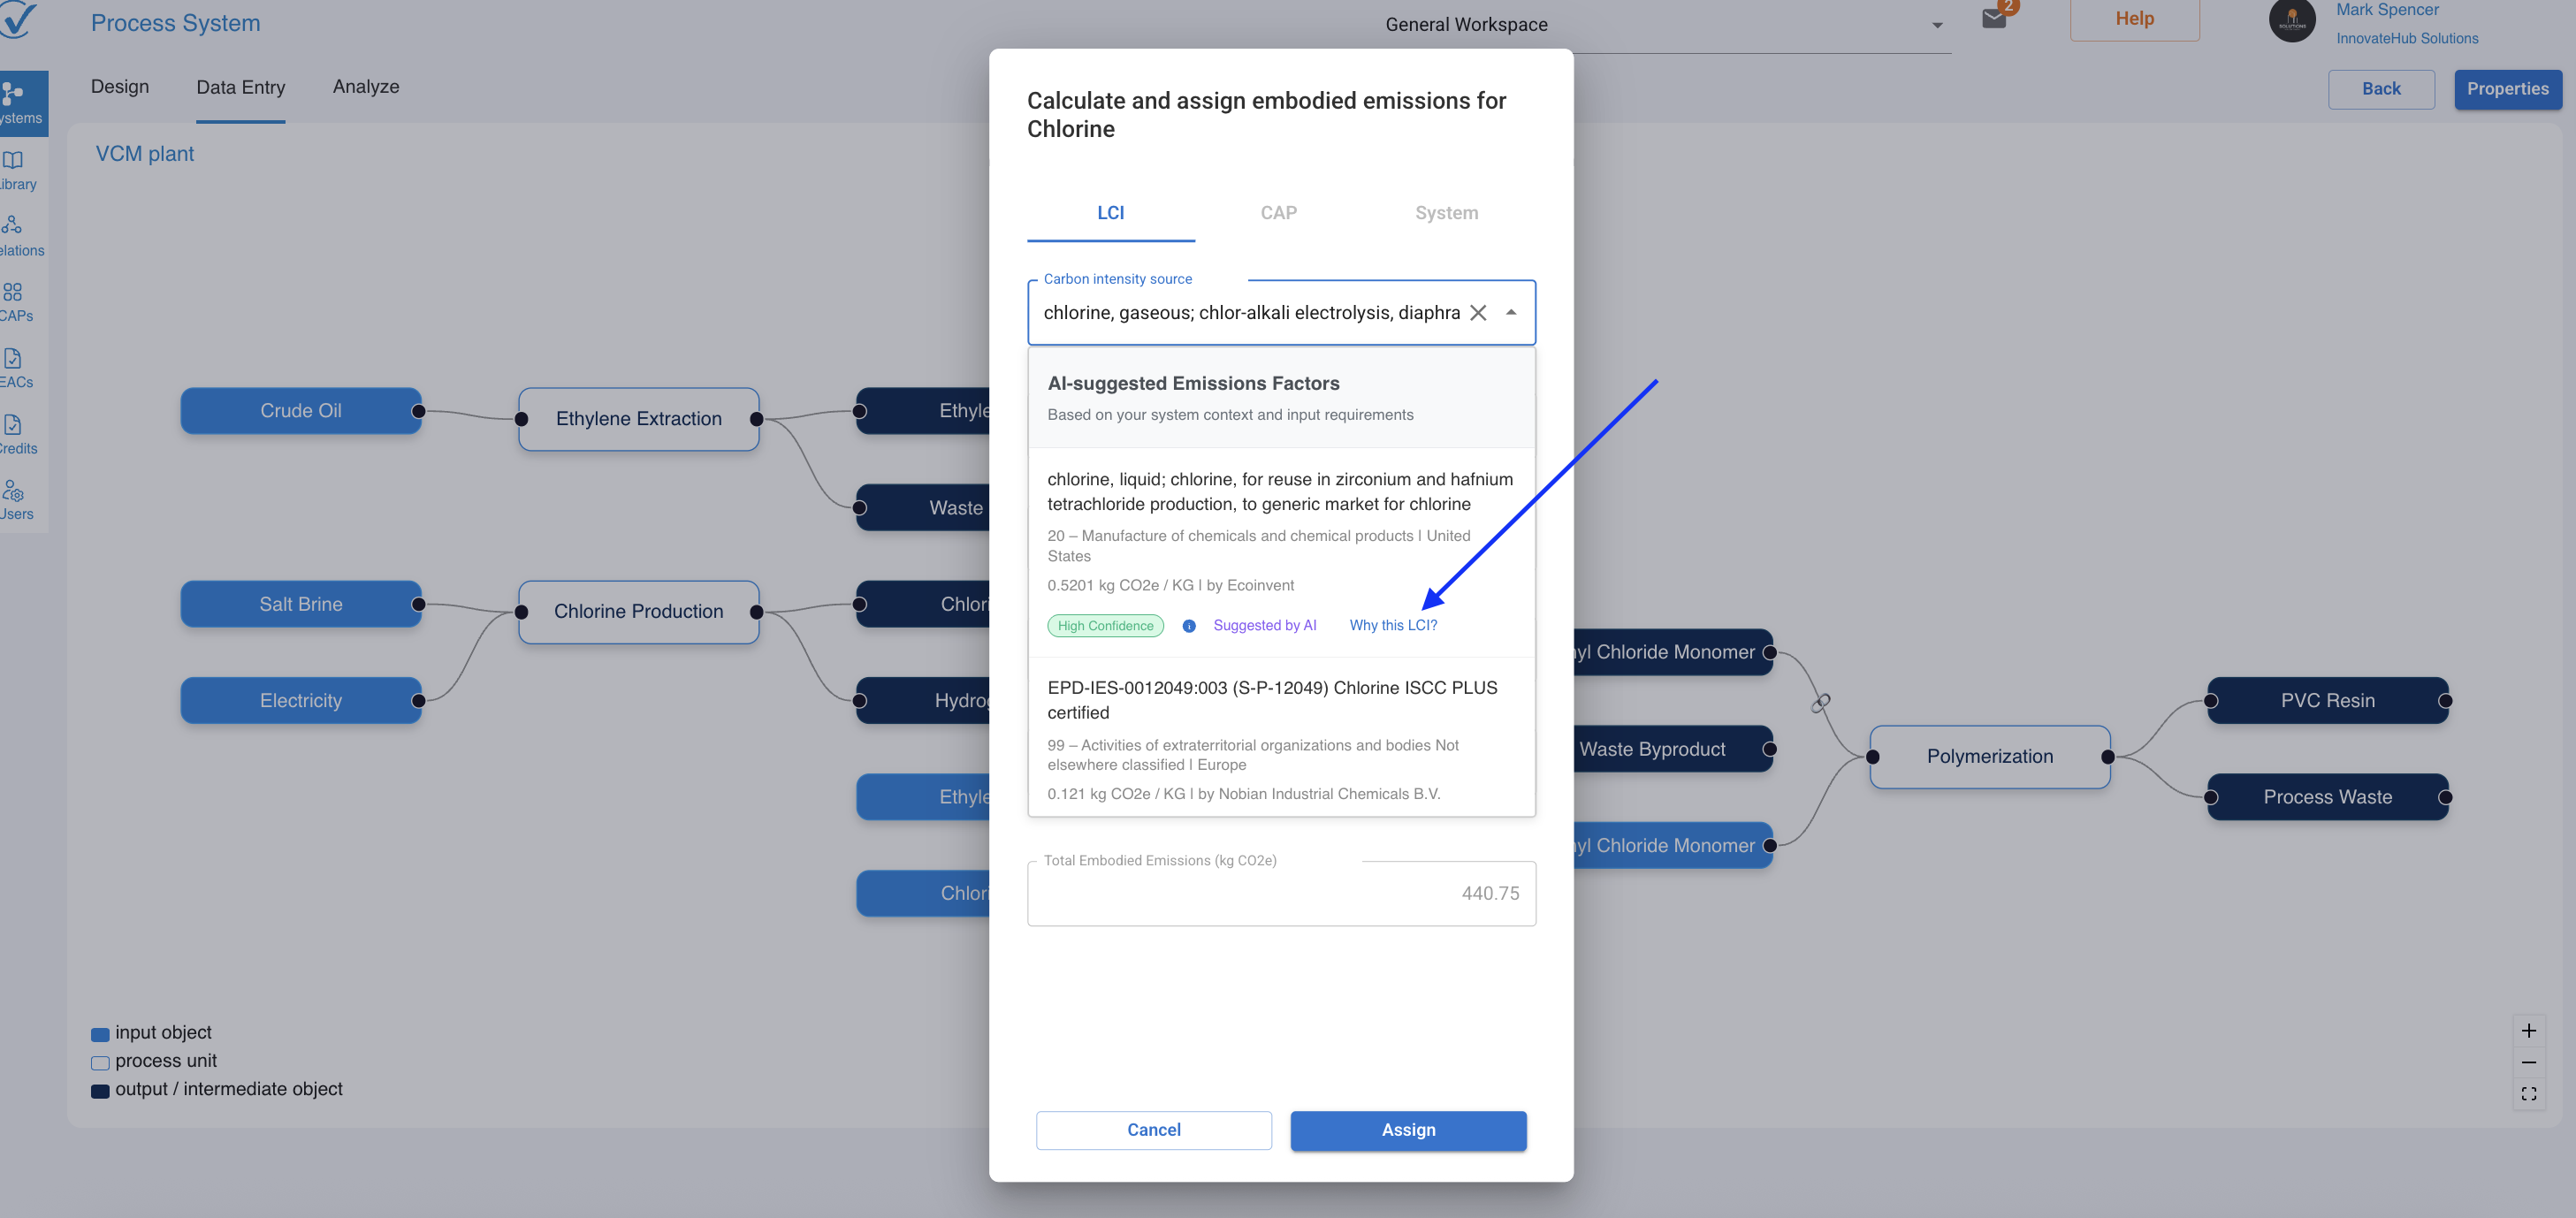
When you click the explanation button, you'll see:
- Selected LCI name and ID
- Summary of selection rationale (name matching, geography, data quality)
- Confidence score (High/Medium/Low)
- Key matching parameters used in the decision
- Source information (database, attestation details)
Search Behavior
Important: The system handles mismatched information intelligently. For example, if you search for "water" but add notes about "aluminum window frames" (unrelated), the system:
- Detects the semantic mismatch
- Prioritizes the primary search term ("water")
- May return results or empty set depending on relevance threshold
Best Practices
For Quick Validation:
- Check the confidence score first—High confidence suggestions typically need minimal review
- Verify geography matches your requirements
- Confirm the emission unit matches your input needs
For Detailed Audit:
- Review attestation information for data provenance
- Check attestation date to ensure data currency
- Use the explanation as audit documentation
When to Override:
- Low confidence scores warrant closer examination
- Geography doesn't match your specific needs
- You have more specific proprietary data available
3. System Template Status Indicator
What It Is
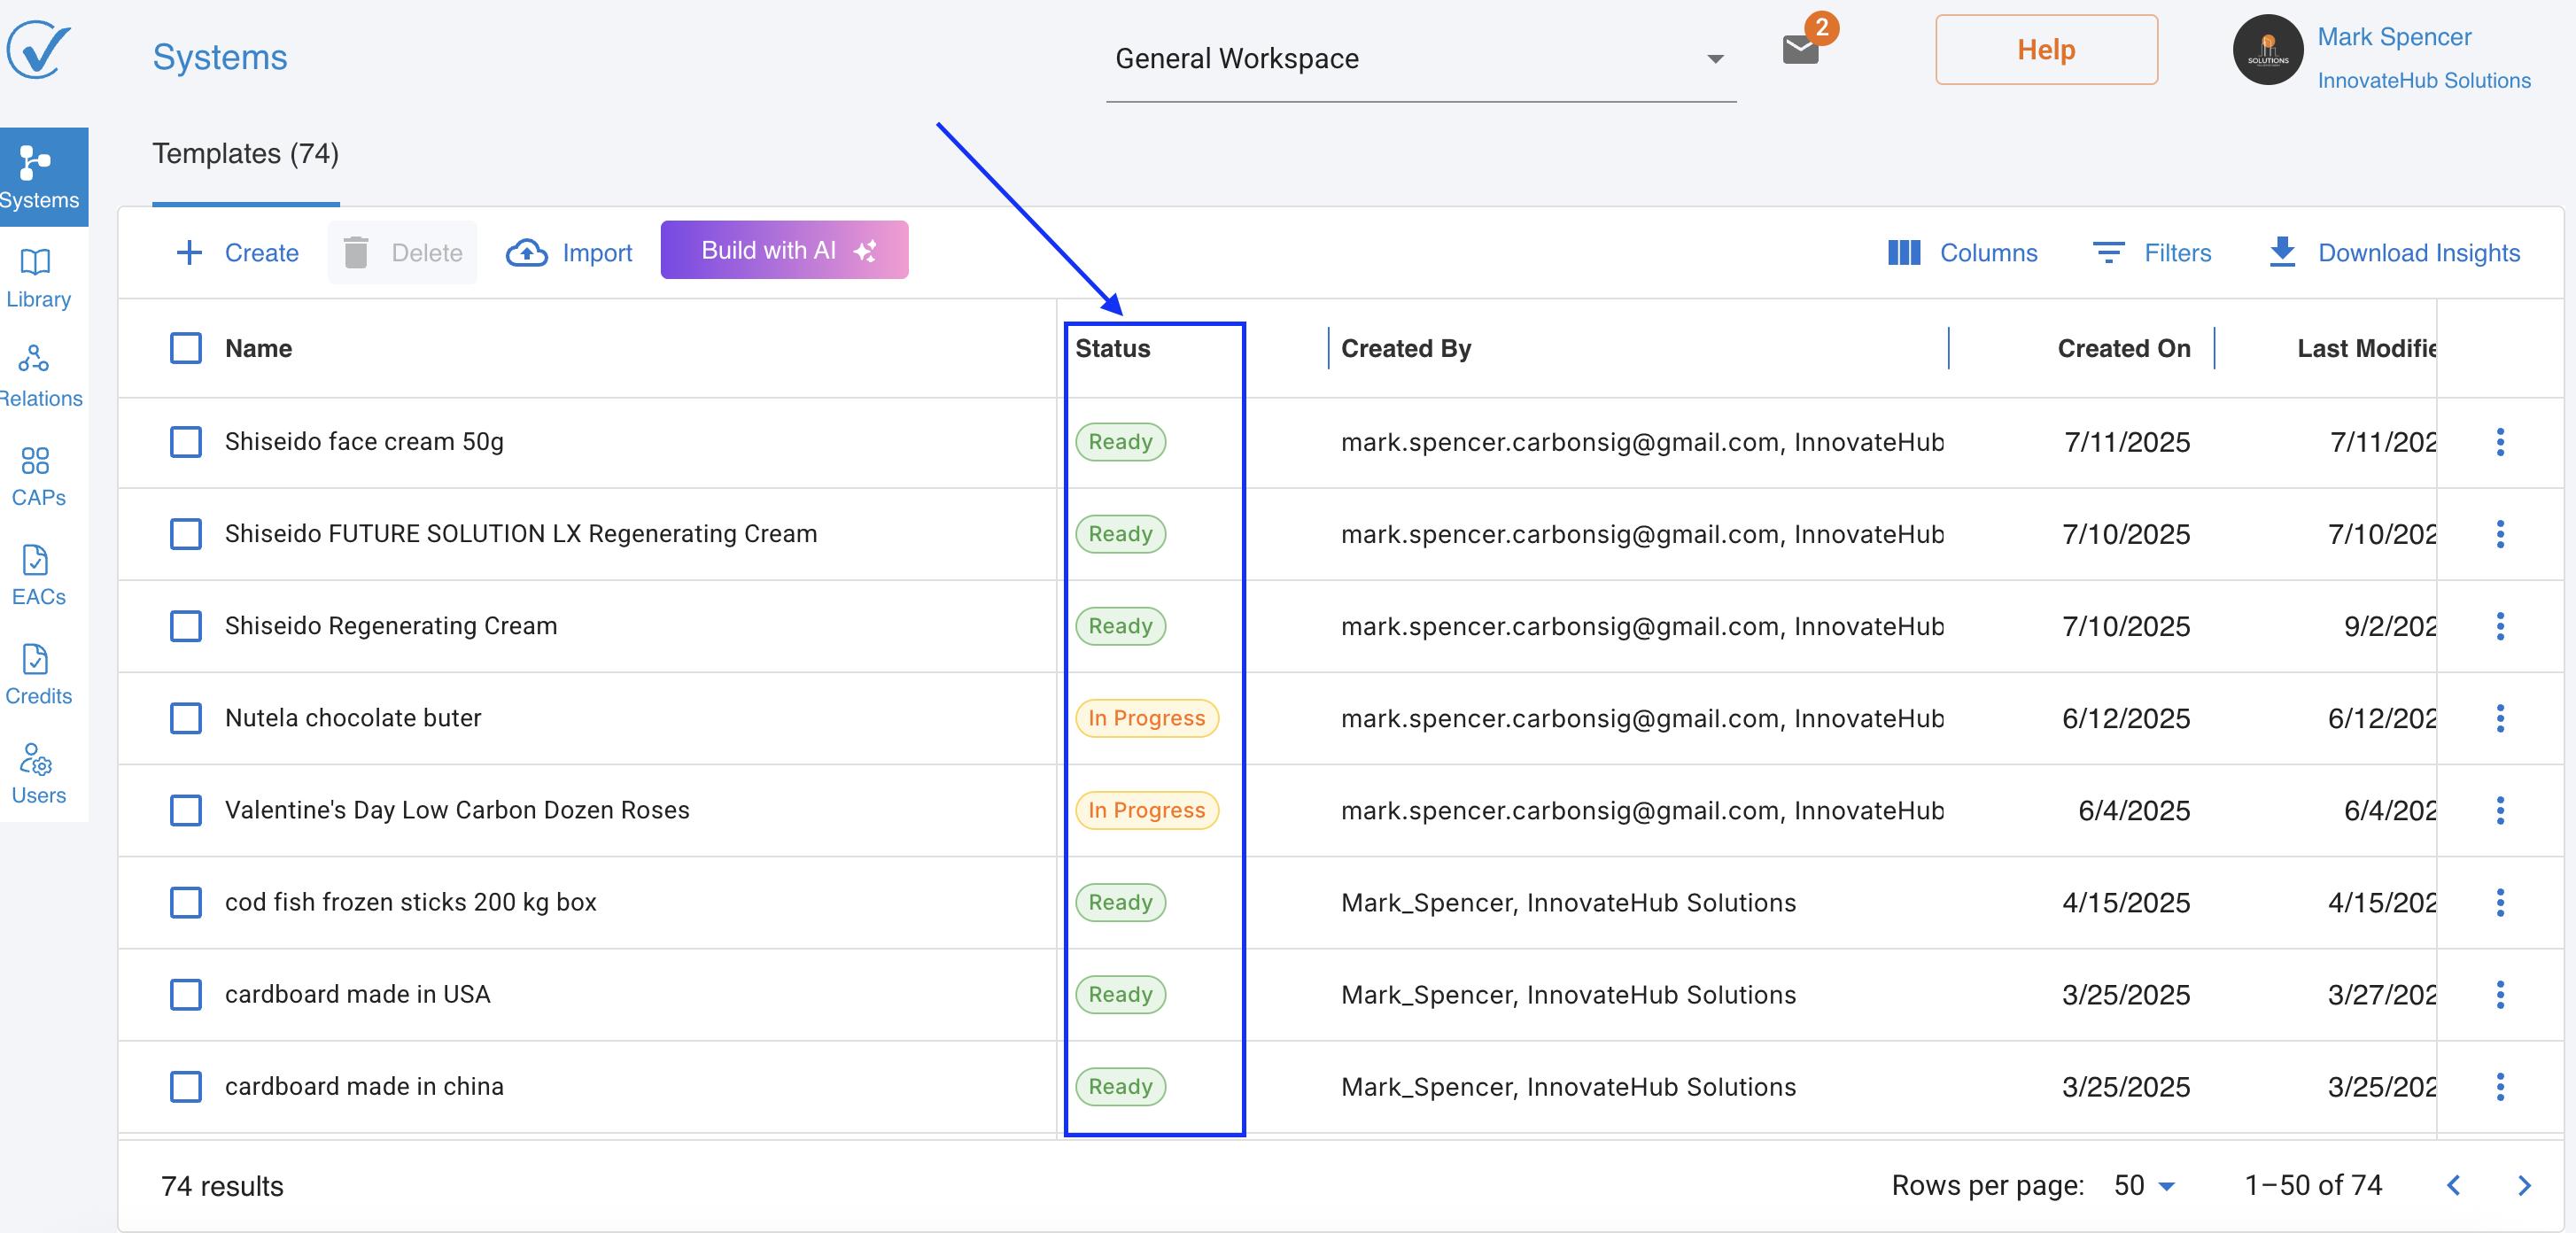
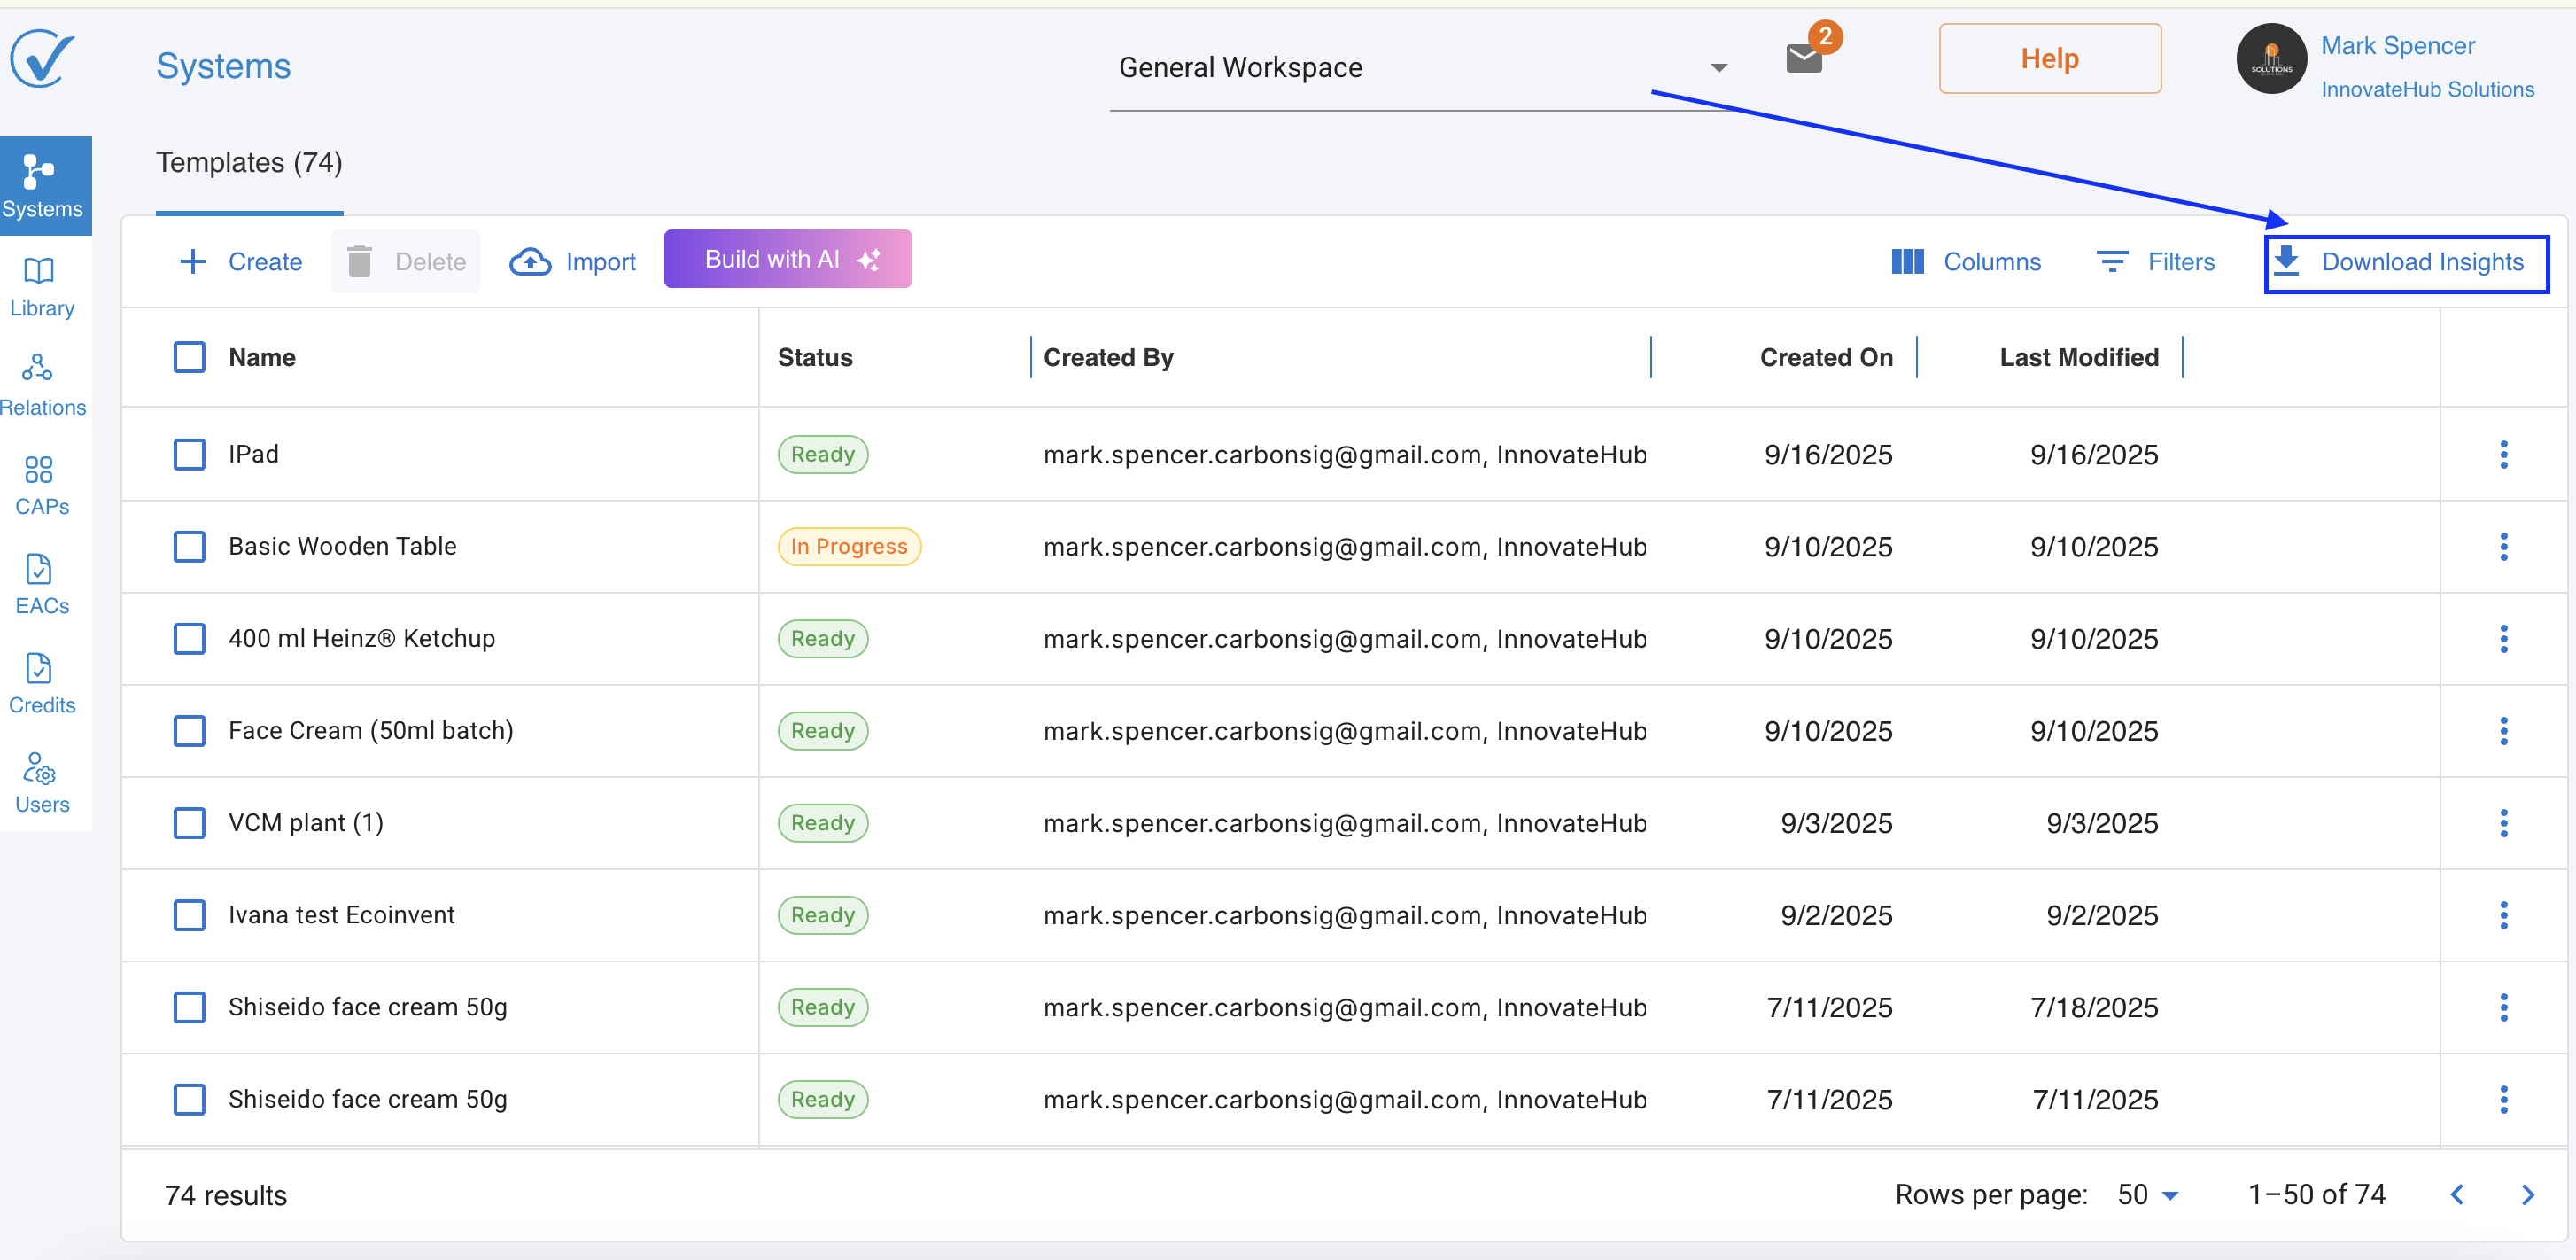
The System Template Status feature provides instant visual identification of system completion states directly on the System Template page. A new Status column positioned beside the System Name displays clear indicators—"Ready" or "In Progress"—allowing users to quickly assess which systems are complete and ready for use, and which require additional work.
Business Value
This capability enables you to:
- Eliminate confusion about system completion status
- Streamline workflows by prioritizing incomplete systems
- Improve project management with at-a-glance progress tracking
- Save time by avoiding the need to open each system to check completion
- Maintain quality by ensuring only complete systems are used for analysis or CAP generation
- Enhance collaboration by providing teams with clear visibility into work status
How It Works
Location: System Template page → Status column (beside System Name)
The status indicator automatically updates based on the completeness of your system's data and connections. The system continuously evaluates whether all required information is present and properly configured.
Status Definitions
Ready Status ✅
A system displays "Ready" when it meets all completion criteria:
Data Completeness:
- All input nodes have assigned emission sources (LCI, CAP, or System)
- All quantities are entered
- All conversion factors are specified
System Connectivity:
- All nodes are properly connected
- No broken or missing links
- Complete emission flow from inputs through processes to outputs
Calculation Status:
- Emission calculations are complete
- Carbon intensity values are calculated
- System is ready for analysis
What "Ready" Means:
- System can be used for reliable carbon footprint calculations
- Ready for analysis in Analyze mode
- Suitable for CAP generation
- Can be confidently shared or exported
In Progress Status ⏳
A system displays "In Progress" when any completion criteria are missing:
Common Reasons for In Progress Status:
- Missing emission source assignments on one or more inputs
- Incomplete quantity data
- Missing conversion factors
- Disconnected nodes or broken system connections
- Partial data entry requiring completion
- System architecture defined but data not yet populated
What "In Progress" Means:
- System cannot yet produce reliable carbon footprint calculations
- Requires additional data entry or configuration
- Not ready for analysis or CAP generation
- Should be completed before sharing
Use Cases
For Individual Users:
- Quickly identify which systems need your attention
- Prioritize data entry work on incomplete systems
- Verify a system is ready before generating a CAP
- Track your personal progress on system development
For Team Leaders:
- Monitor team progress on system completion
- Identify bottlenecks in the carbon accounting workflow
- Allocate resources to incomplete systems
- Ensure data quality before final analysis
For Supplier Managers:
- Track which supplier systems are complete vs. incomplete
- Identify suppliers who may need additional training
- Correlate completion rates with supplier engagement metrics
- Follow up proactively on incomplete submissions
For Enterprise Administrators:
- Obtain workspace-level view of completion status
- Identify patterns in system completion rates
- Make data-driven decisions about training needs
- Monitor overall carbon accounting progress across the organization
Sorting and Filtering: Users can sort the system list by status to:
- View all "Ready" systems together
- Focus on "In Progress" systems needing attention
- Track completion progress over time
Best Practices
Before Starting Work:
- Review the Status column to identify incomplete systems
- Prioritize systems closest to completion
- Plan your data entry sessions based on status indicators
During System Development:
- Check status after each major data entry session
- Use status as a checklist for completion
- Address missing data promptly to achieve "Ready" status
Before Analysis or Sharing:
- Always verify "Ready" status before generating CAPs
- Double-check systems show "Ready" before exporting
- Confirm "Ready" status before sharing with stakeholders
For Quality Assurance:
- Use status as a first-level quality gate
- Investigate any unexpected "In Progress" status
- Establish team standards for when systems should be marked complete
Troubleshooting Common Status Issues
System Shows "In Progress" but Appears Complete:
- Check all input nodes for missing emission source assignments
- Verify all quantities and conversion factors are entered
- Look for disconnected nodes in Design Mode
- Ensure all calculations have processed
Status Not Updating After Data Entry:
- Refresh the page
- Verify data was saved successfully
- Check for any error messages in Entry Mode
- Confirm all required fields are completed
Unable to Generate CAP from "Ready" System:
- Verify system status is definitely "Ready"
- Check for any validation errors in Analyze mode
- Ensure all upstream systems (if linked) are also "Ready"
- Contact support if issue persists
4. Insight Hub (Workspace Analytics Export)
What It Is
The Insight Hub provides on-demand computation and export of aggregated metrics from your workspace systems that are ready for analysis. This feature generates structured Excel exports containing comprehensive system-level and product-level analytics, optimized for both human analysis and AI-assisted insights.
Business Value
The Insight Hub enables you to:
- Obtain workspace-level summary views of all system analytics
- Generate on-demand reports without database storage overhead
- Export data in structured formats for external analysis
- Enable AI-assisted analysis with consistent, prompt-ready formatting
- Facilitate strategic decision-making with comprehensive carbon data visibility
How It Works
Access Point: System page → "Download Insights" button
The system generates Excel files containing:
- Systems-level data: Aggregated metrics for all systems that have "Ready" status in your workspace
- Products-level data: Detailed breakdown for products within each system
- Optional Contributors data: (Future enhancement) Granular contributor-level information
Data Hierarchy
The export follows a nested structure:
- Level 1: Systems (workspace-level aggregation)
- Level 2: Products (system-level breakdown)
- Level 3: Contributors
File Format: Excel (.xlsx)
Data Quality Assurance:
- Consistent column headers across exports
- Flattened nested arrays for easy processing
- No merged cells (AI-friendly formatting)
- Clean, structured tables suitable for automated analysis
Use Cases
Strategic Planning:
- Export workspace data for board presentations
- Analyze trends across multiple systems
- Identify carbon reduction opportunities
Compliance Reporting:
- Generate comprehensive emissions summaries
- Create audit-ready documentation
- Track progress against sustainability targets
Data Integration:
- Import into business intelligence tools
- Combine with financial data for cost analysis
- Share with external stakeholders
Best Practices
Before Export:
- Ensure systems contain current data
- Verify all relevant systems are included in your workspace
- Consider filtering scope if only specific systems are needed
After Export:
- Review metadata to confirm export parameters
- Validate key metrics against expected ranges
- Store exports with appropriate version control for trend analysis
Integration Across Features
These four features work together to provide comprehensive visibility and streamlined carbon accounting workflows:
- System Template Status provides instant visibility into completion state of systems
- Supplier Licence Tracking monitors who is creating systems and CAPs
- AI LCI Explanation ensures transparency in the data those systems use
- Insight Hub aggregates system-level results for strategic analysis
Example Workflow:
- Prioritize work using System Template Status to identify incomplete systems
- Track supplier engagement through Supplier Licence Tracking to monitor system creation activity
- Verify data quality by checking that suppliers are using appropriate LCI data through AI Explanations
- Identify completion patterns by correlating system status (Ready vs. In Progress) with supplier activity metrics
- Generate comprehensive analytics through Insight Hub for strategic decision-making
- Make data-driven decisions about supplier relationships, training needs, and carbon reduction strategies
🤝 Feedback & Support
We value your feedback as we continue to enhance CarbonSig. If you have questions or suggestions regarding these updates:
- Contact our support team at support@carbonsig.com
- Submit feature requests through the in-app feedback tool
Thank you for being part of the CarbonSig community. Together, we're building a more sustainable future.
Related Documentation
- Supplier Management in CarbonSig
- Supplier Onboarding Guide
- Reference Emission Data Library
- AI-Powered System Builder
Keywords: supplier tracking, sub-license activity, AI transparency, LCI explanation, workspace analytics, insight hub, carbon accounting, emissions data, supplier management, AI-suggested data, system metrics, CAP tracking, reference emission data, semantic search, audit compliance