
Build your system model in Builder
What is a complete system?
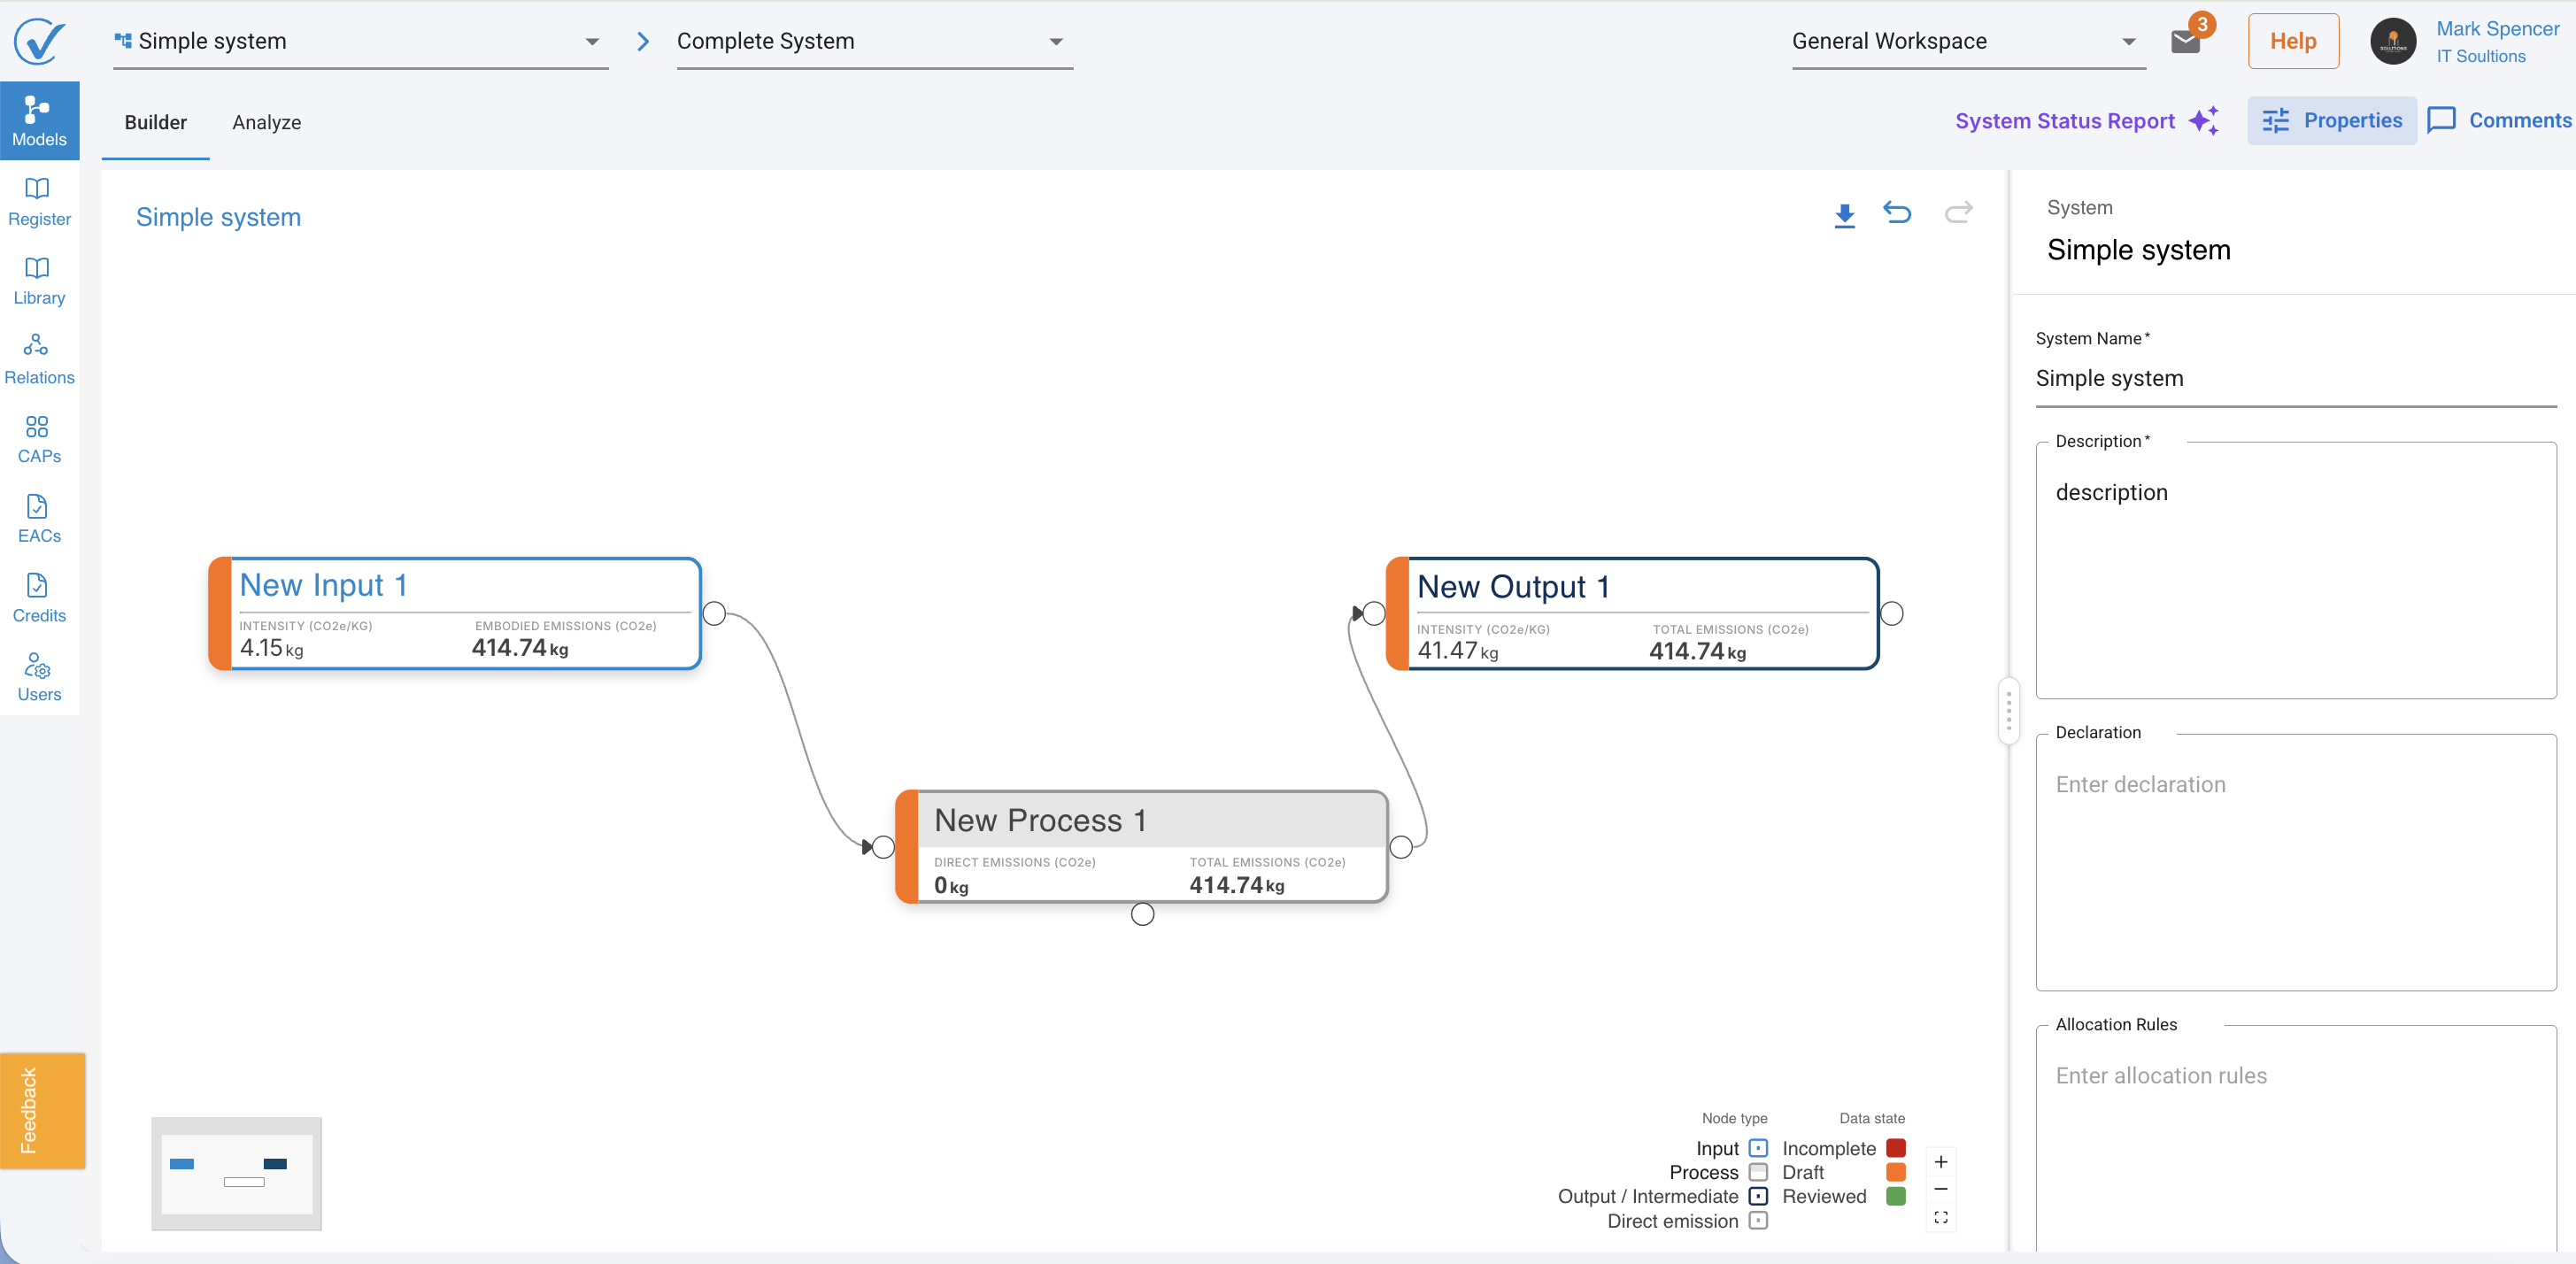
A minimal working model needs:
- At least one process (your activity that generates emissions)
- At least one input (emission source connected to the process)
- At least one output (result or product from the process)
- Direct emissions (optional, for Scope 1 emissions)
All required fields must be populated for the Analyze tab to become active. Review toggles (turning nodes green) are optional but recommended for quality assurance.
Example simple system:
Understanding node status colors
Before you start building, understand what node colors mean. Every node displays color-coded status showing data completion:
Color | Status | What it means |
| 🔴 Red | Incomplete | Node exists but has no data yet |
| 🟧 Orange | Needs review | Contains data but not yet verified |
| 🟩 Green | Approved | All data reviewed and confirmed |
What each color means
🔴 Red (Incomplete)
You see this when:
- You just created a new node
- No emission data has been entered yet
- Required fields are empty
What to do: Add data to all required fields. Node changes color once data is entered.
🟧 Orange (Needs review)
You see this when:
- Node has data but you have not approved it
- Data was generated by "Build with AI"
- Data was suggested by "Suggest LCI with AI"
- You or a teammate entered data manually but did not toggle review
What to do: Review the data in the node. Toggle review button ON if satisfied. Node turns green.
🟩 Green (Approved)
You see this when:
- You explicitly reviewed and approved the node data
- All calculations have been verified
- Node is ready for analysis and reporting
What this means: Highest confidence level. Data has been human-verified. Ready for final reporting.
Why colors matter
Visual progress tracking:
- Quickly see which nodes still need work
- Identify completion status at a glance
- Focus on red nodes first, then orange
Team collaboration:
- Share systems with clear visual indicators
- Teammates know which nodes need attention
- Avoid duplicate work on same nodes
Quality assurance:
- Green nodes signal verified data
- Orange nodes flag unreviewed information
- Red nodes indicate missing data
Step 1: Add a process
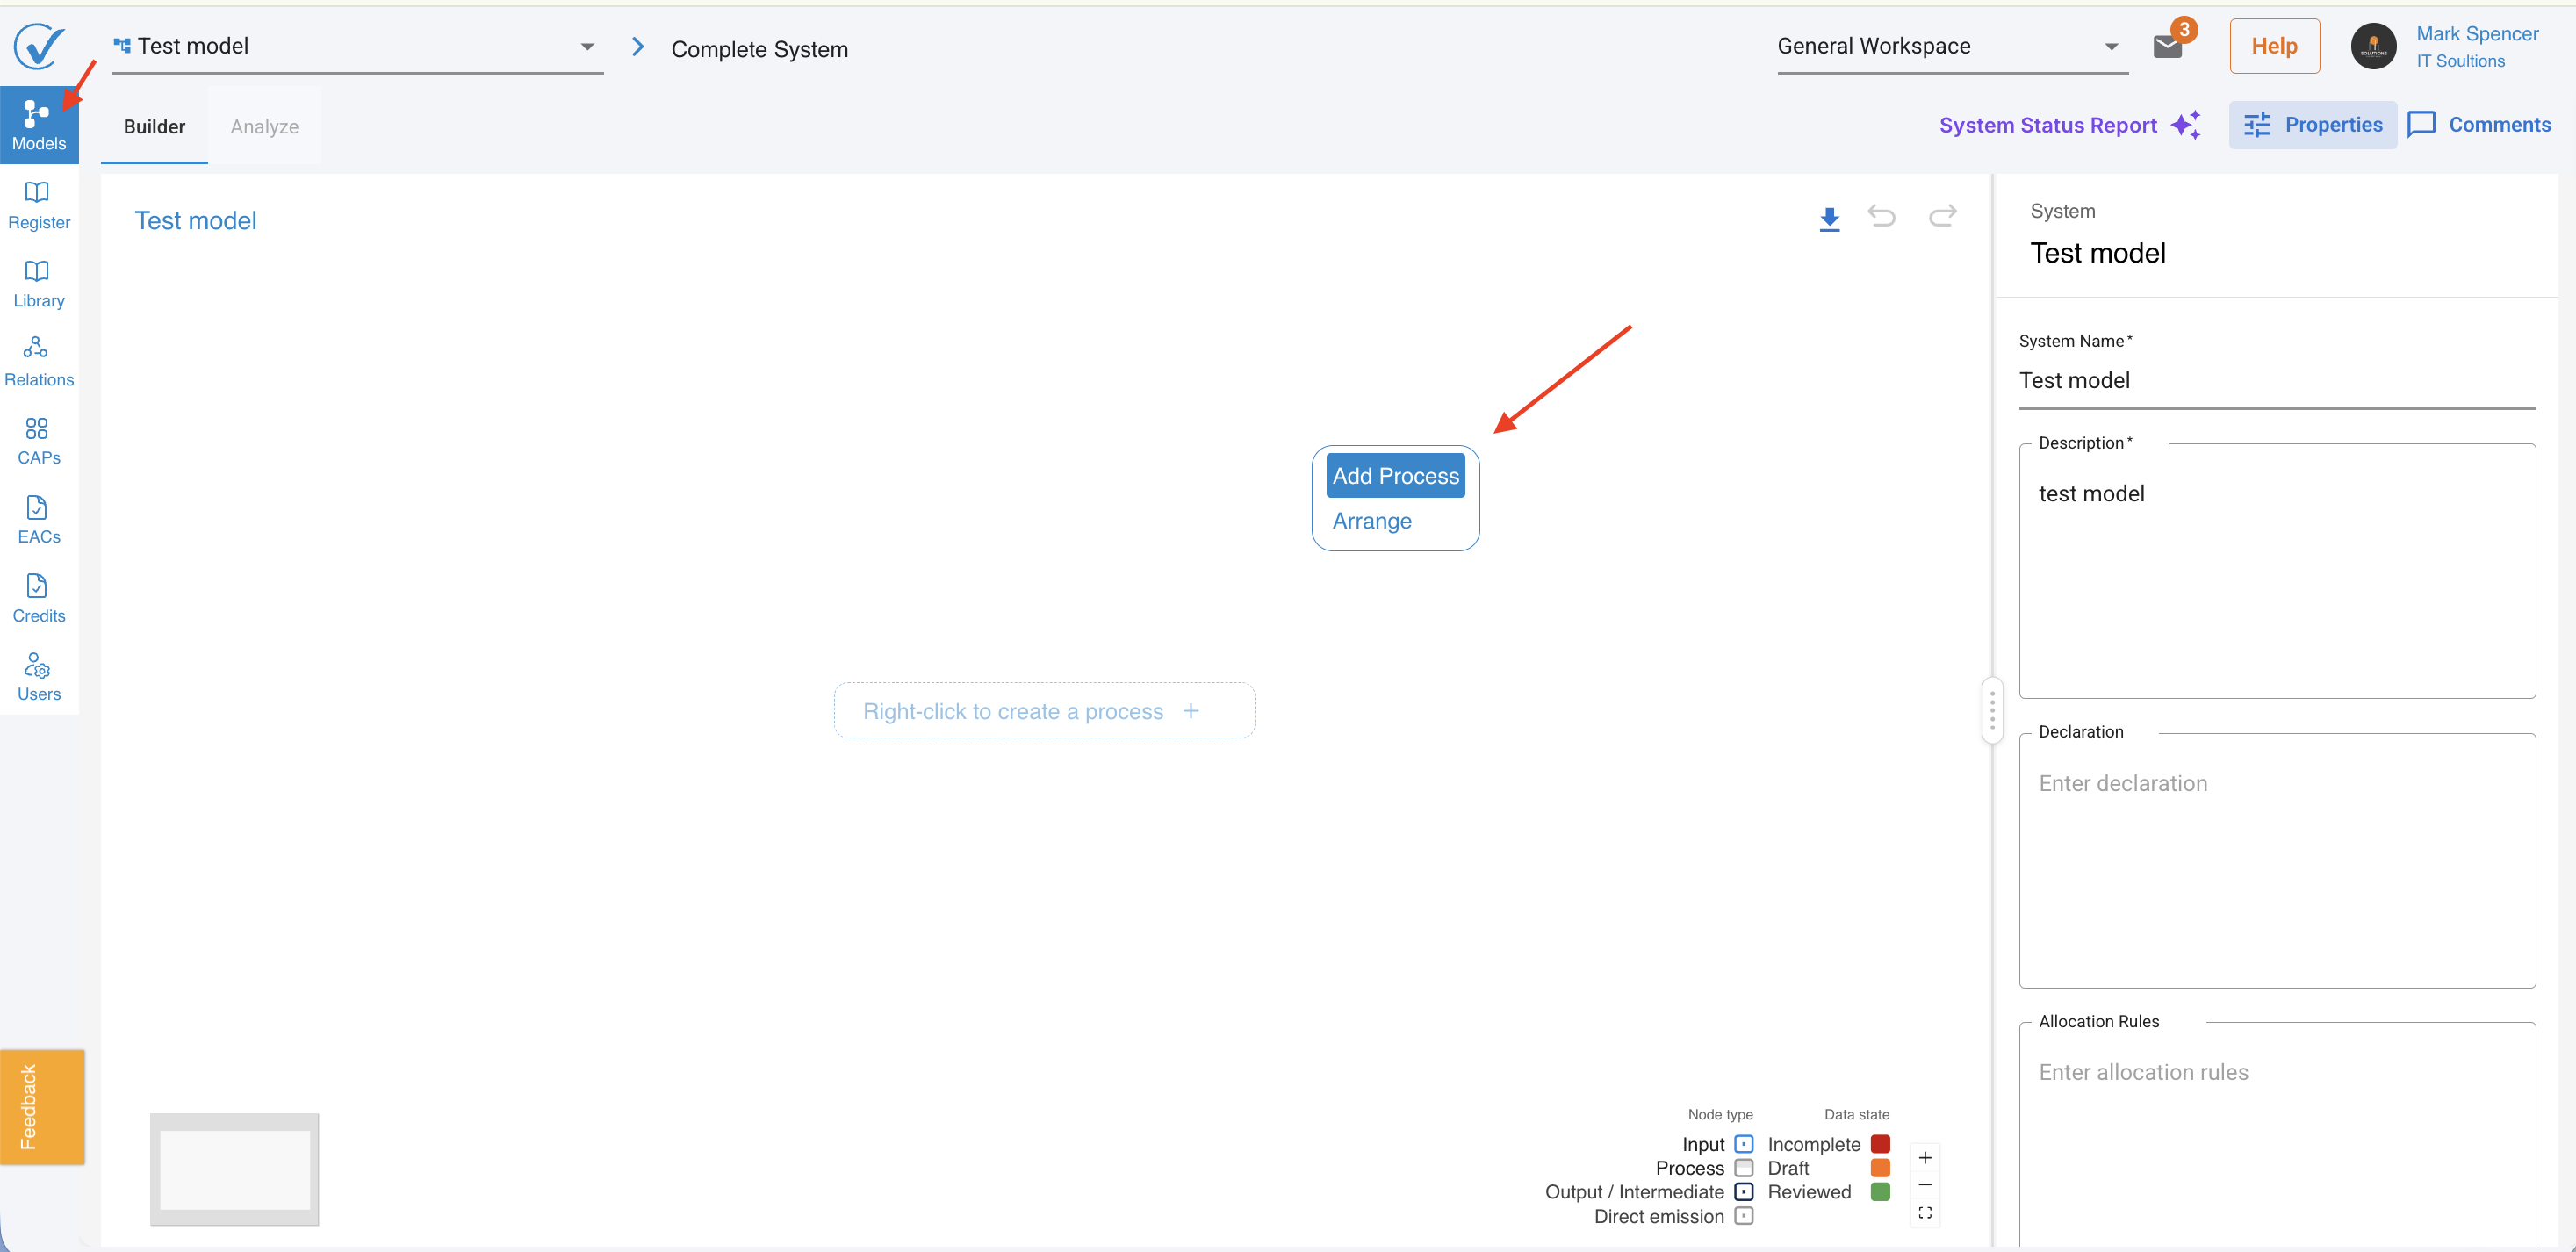
When you first open Builder, the Properties sidebar shows your system information. To start building:
- Right-click anywhere on the canvas
- Select Add Process
What you see: A new process node appears with the default name "New Process" and the right sidebar switches to show process fields.
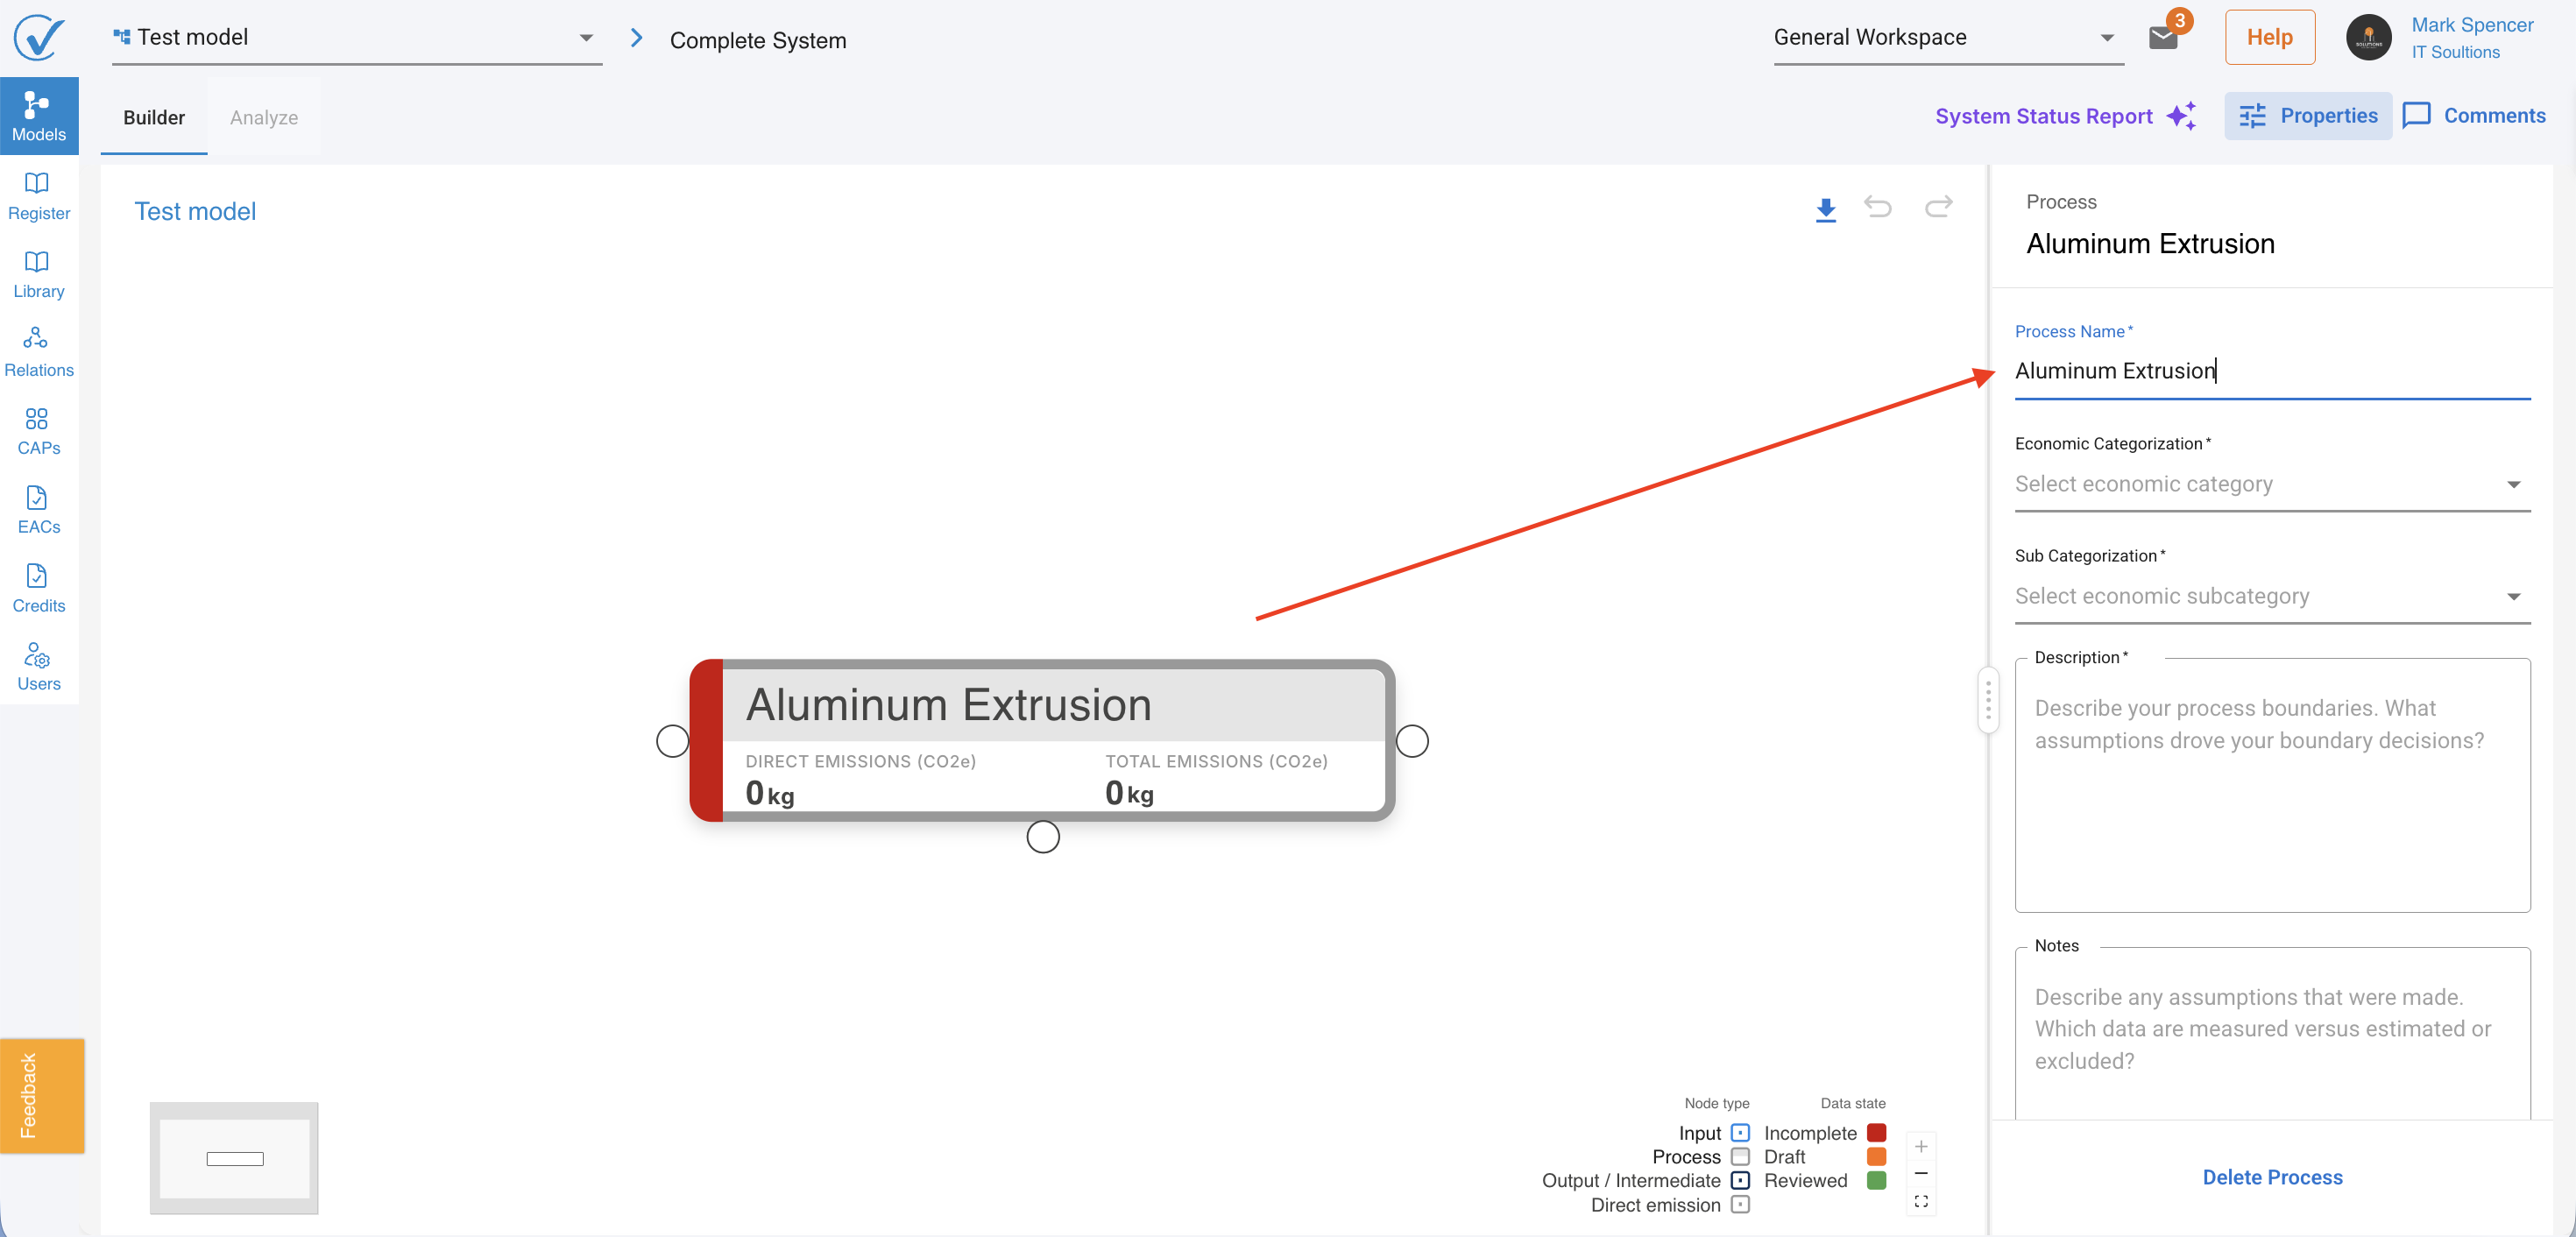
Complete process fields
Required:
- Process name (e.g., "Aluminum Extrusion")
Optional:
- Economic categorization
- Sub categorization
- Description
- Notes
Autosave enabled
You can save with just the process name and return later to complete other fields. All changes save automatically as you work.
Visual feedback:
- "Saving..." appears during save operations
- "Saved" confirms completion
- No manual save button needed
Step 2: Add inputs (emission sources)
Inputs represent where emissions come from, including purchased electricity, materials, transportation, and other emission sources.
- Right-click on your process
- Select Add Input
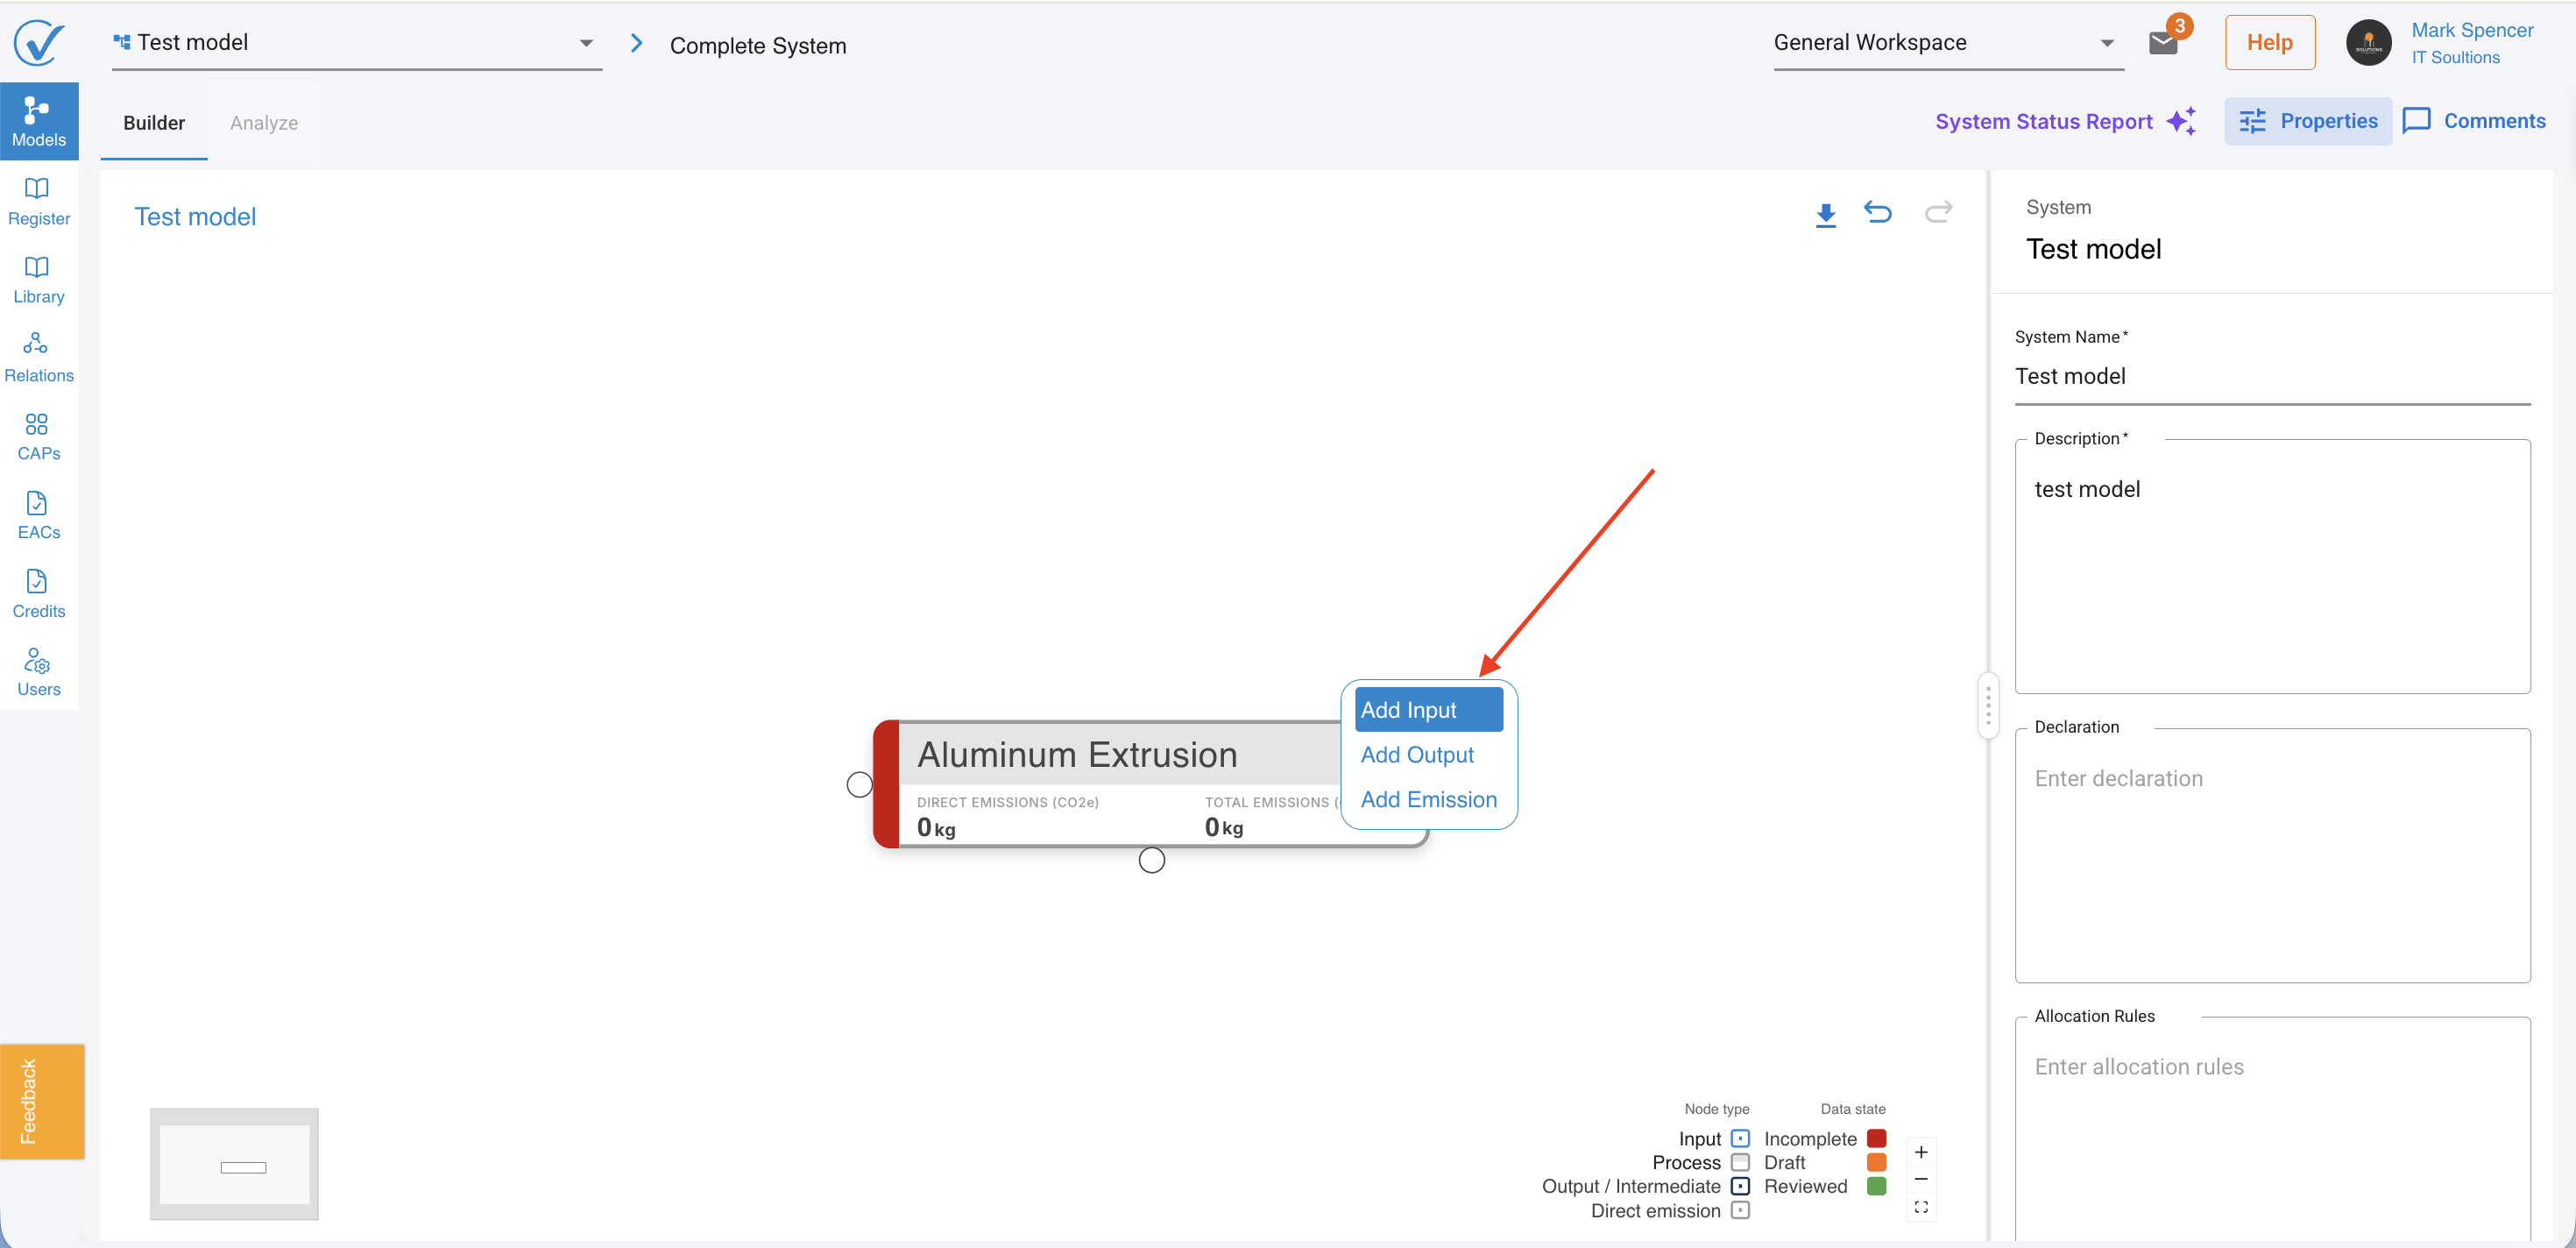
What you see: A new input node appears on canvas with default name "New Input" and the right sidebar opens with input fields.
Required fields for inputs
To calculate emissions, you need:
Field | Purpose | Example |
| Title | Input name | "Electricity, grid mix, Europe" |
| Quantity | Amount consumed | 1000 |
| Unit | Measurement unit | kWh |
| Emission Category | Scope 2 or Scope 3 | Scope 2 |
| Carbon Intensity Source | Emission factor source | Reference Emission Factor |
| Conversion Factor | Unit alignment | 1.0 (if units match) |
Optional fields:
- Notes
- Document uploads
Calculated automatically:
- Total embodied emissions (kg CO2e)
- Converted carbon intensity (kg CO2e per unit)
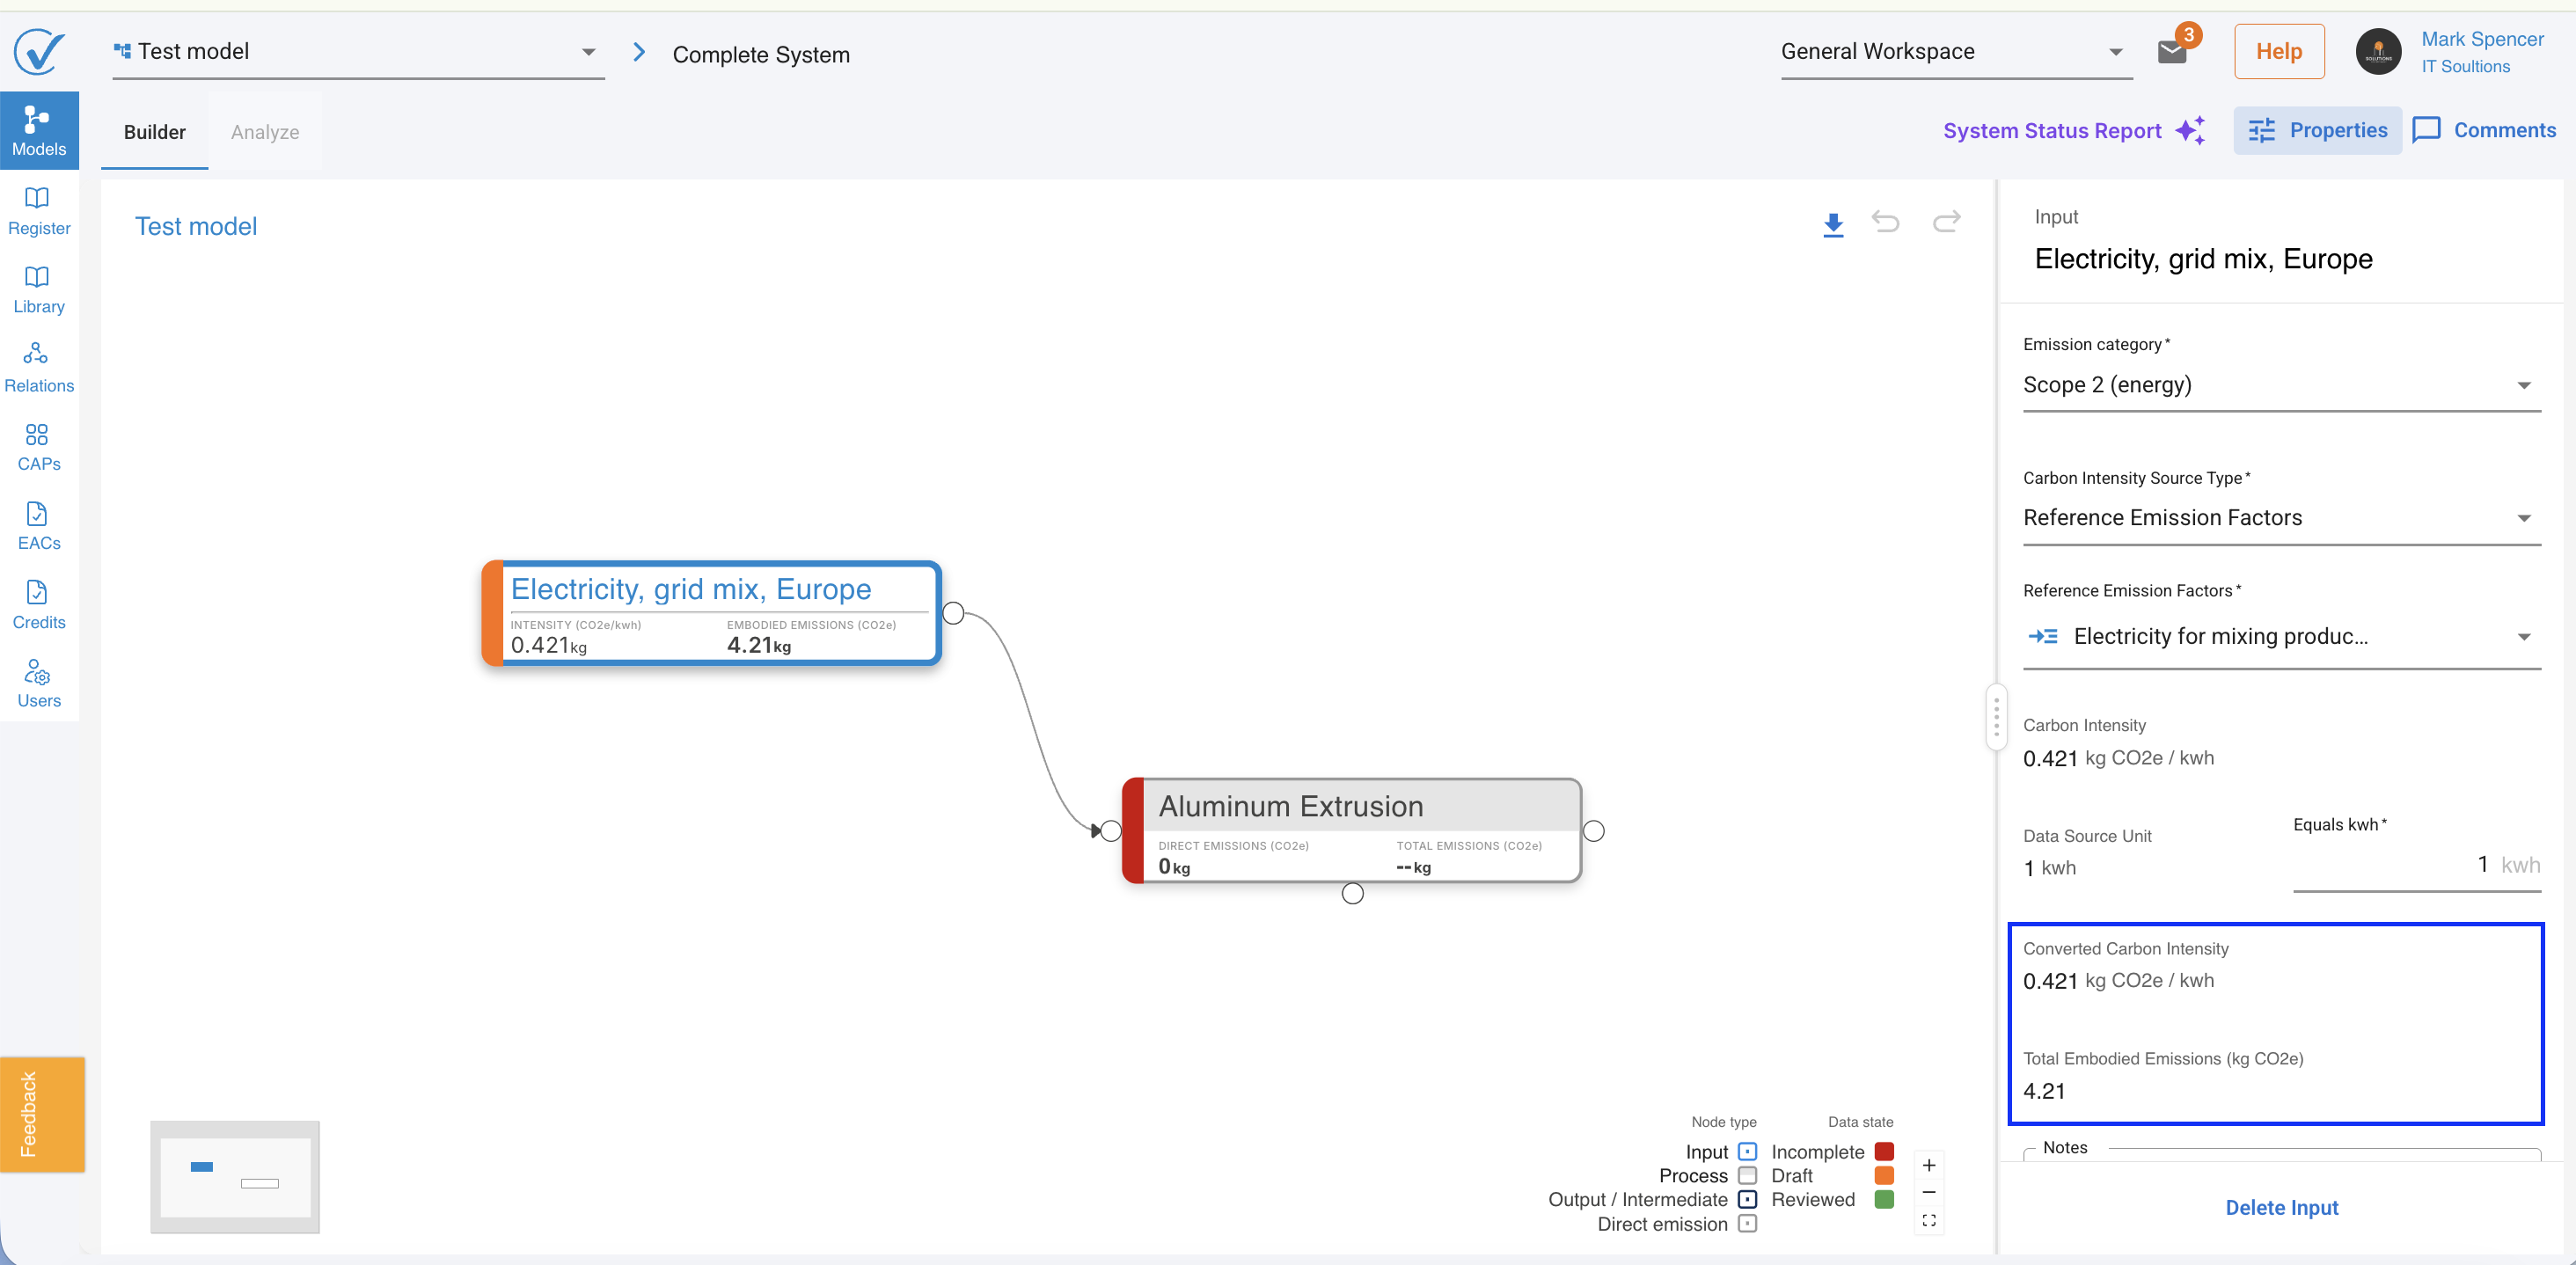
Emission category examples
Scope 2 Emissions:
- Electricity (grid mix)
- Purchased heat
- Steam
Scope 3 Emissions:
- Business travel
- Waste disposal
- Transportation of goods
- Purchased materials
Why this matters: Proper scope classification ensures accurate carbon accounting and reporting.
Choose your carbon intensity source
You have three options for emission data:
Source Type | When to use | What you need |
| Reference Emission Factor | Use standard emission factors from database | Conversion factor, quantity |
| CAP/EAC | Use verified emissions from suppliers | Existing CAP or EAC, quantity |
| System Output | Link to another system you created | Existing system, quantity |
Using Reference Emission Factors
Search or browse:
- Click the Carbon Intensity Source dropdown
- Search for emission factor (e.g., "Electricity, grid mix, Europe")
- Select from search results
Or use AI suggestions:
- Click "Ask AI to suggest emission" button in the dropdown
- System recommends best match with confidence score (High/Medium/Low)
- Review explanation of why it was selected
- Accept suggestion or search manually
When to use AI suggestions: Click "Suggest LCI with AI" when you need help selecting emission factors. AI suggestions trigger only when you click the button, not automatically when opening nodes. This improves performance and lets you control when you need AI assistance.
What happens after selection:
System calculates:
- Emission intensity (kg CO2e per unit)
- Total emissions (kg CO2e)
- Connection line turns solid (data entered, node turns orange)
Best practices for AI suggestions:
- High confidence → Quick review and accept
- Medium/Low confidence → Verify details carefully
- Always check geography matches your needs
More details: Suggest LCI with AI: AI-Powered Emission Data Selection
Using CAP/EAC sources
- Select CAP or EAC from your inventory
- Enter quantity used
What happens: Emissions pulled from CAP/EAC automatically.
Using System Output sources
- Select existing system from your list
- Enter quantity
What happens: Emissions calculated from linked system.
Autosave and flexibility
All changes save automatically. You can work at your own pace and return later to complete fields.
💡 Tip: Add multiple inputs to one process. Most processes have several emission sources (electricity, materials, transportation, etc.).
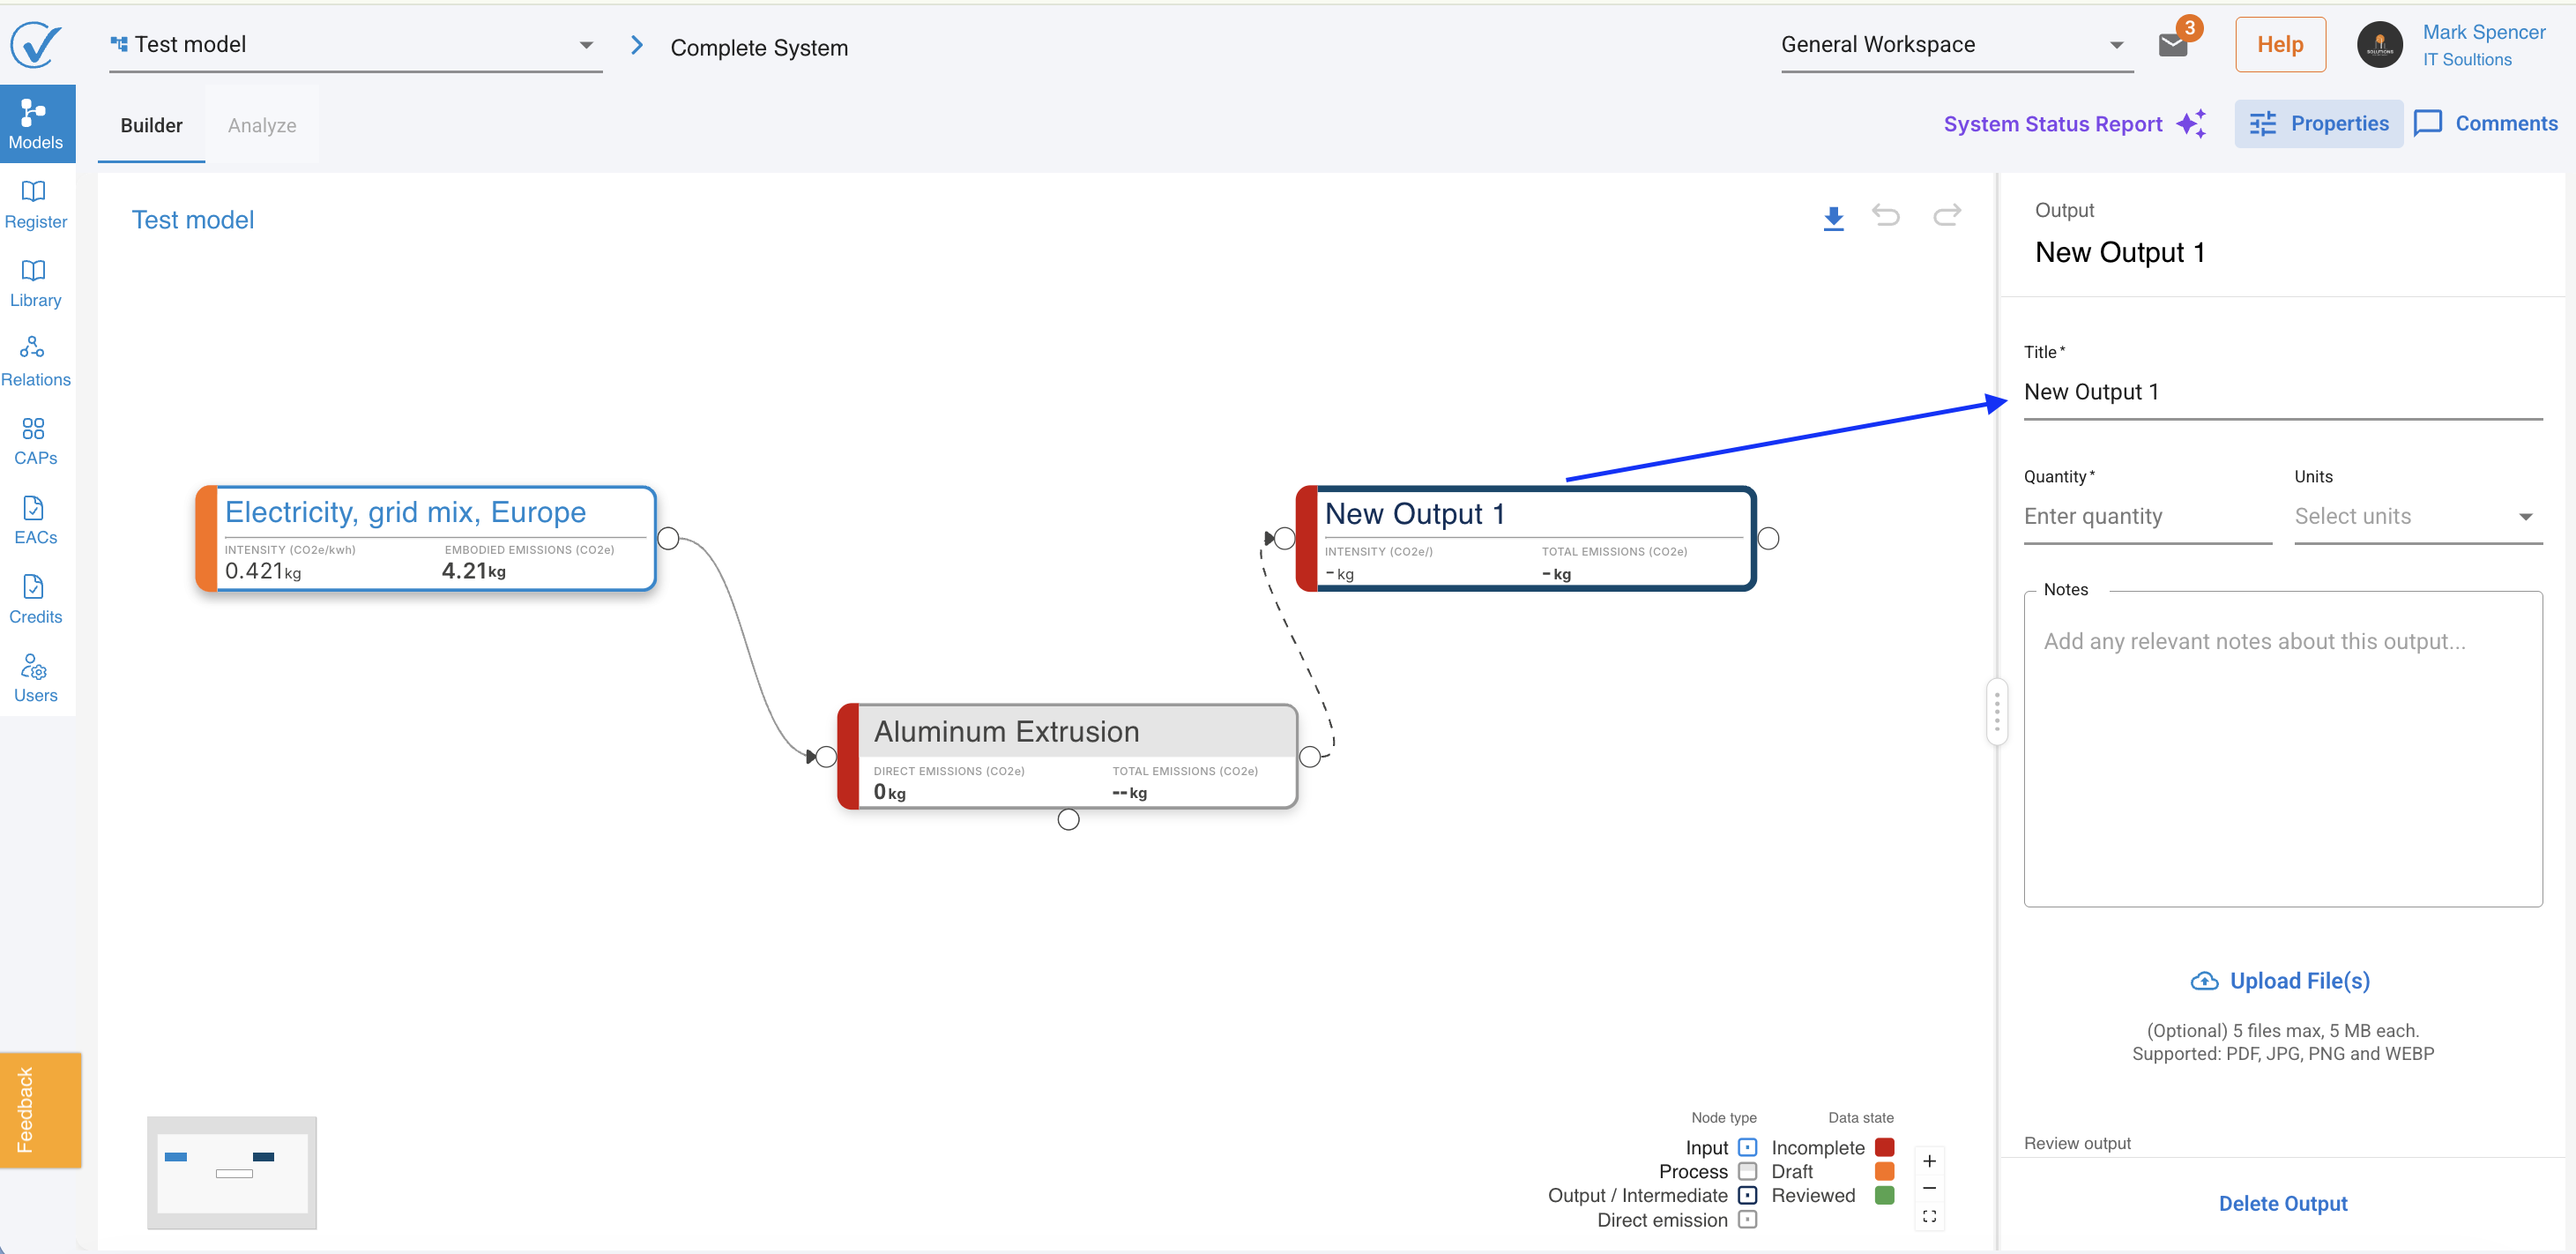
Step 3: Add outputs (results)
Outputs represent the products or results from your process. These can be final products or intermediate materials that feed into other processes.
- Right-click on your process
- Select Add Output
What you see: A new output node appears on canvas with default name "New Output" and the right sidebar opens with output fields.
Output allocation
When you add an output, Builder automatically adds an allocation section to the process node.
Single output: Allocation defaults to 100% (no action needed)
Multiple outputs: You must define how emissions split between outputs:
- Proportional to quantity: System calculates allocation based on output quantities
- Manual percentage: Enter specific percentages (must total exactly 100%)
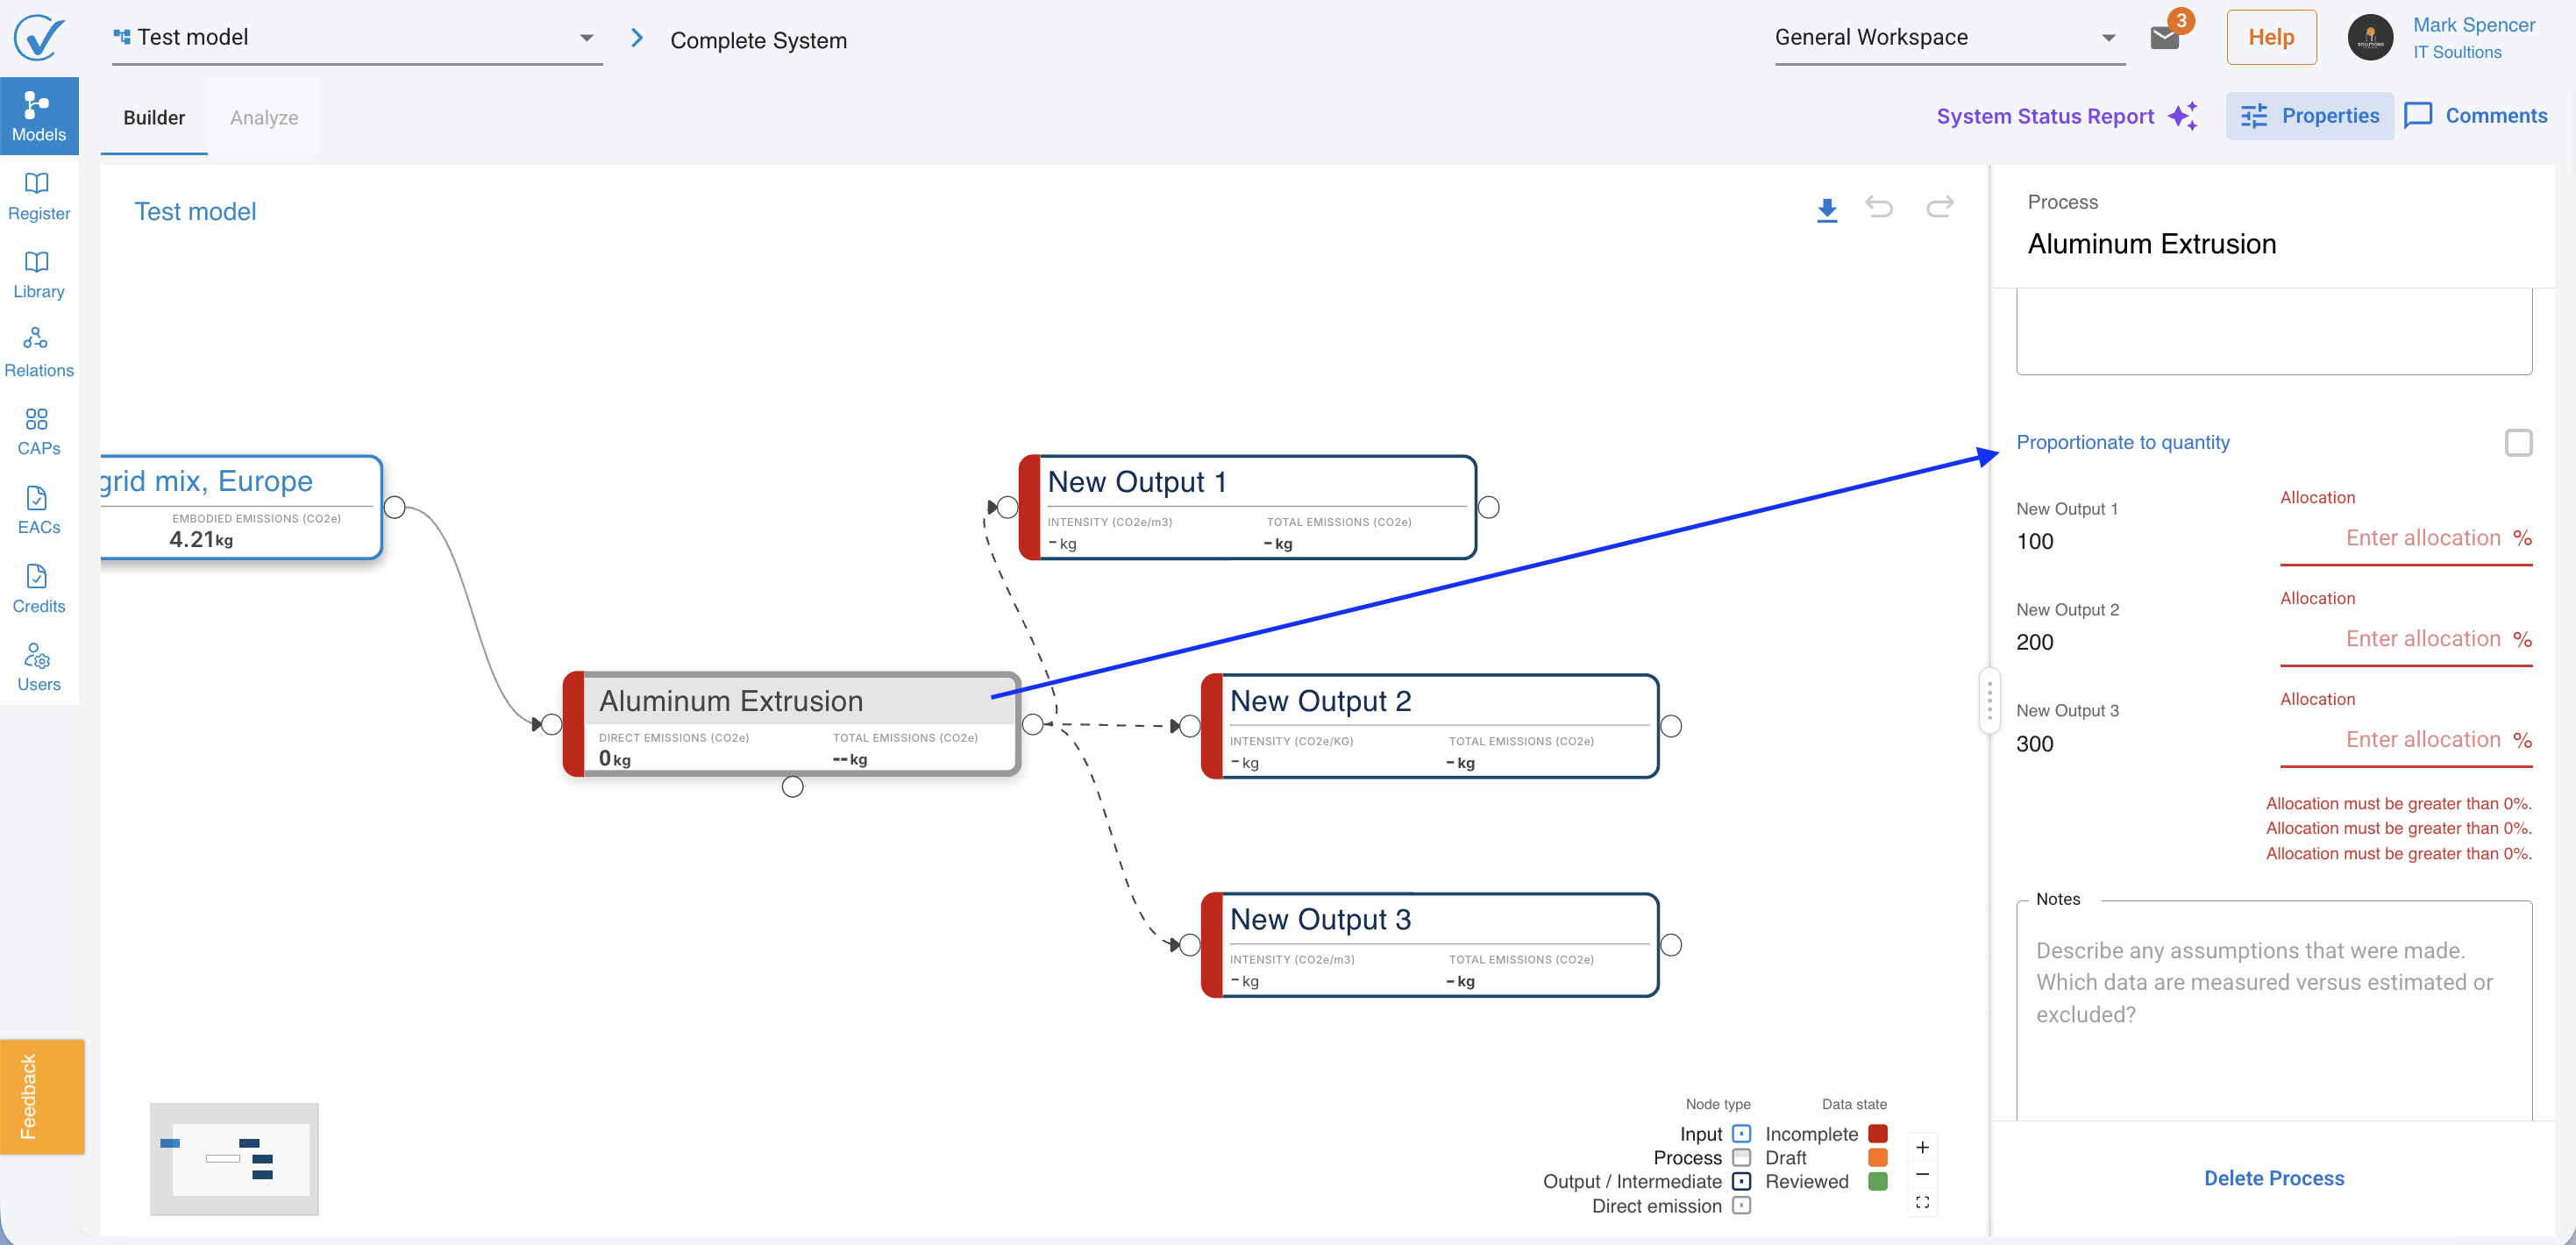
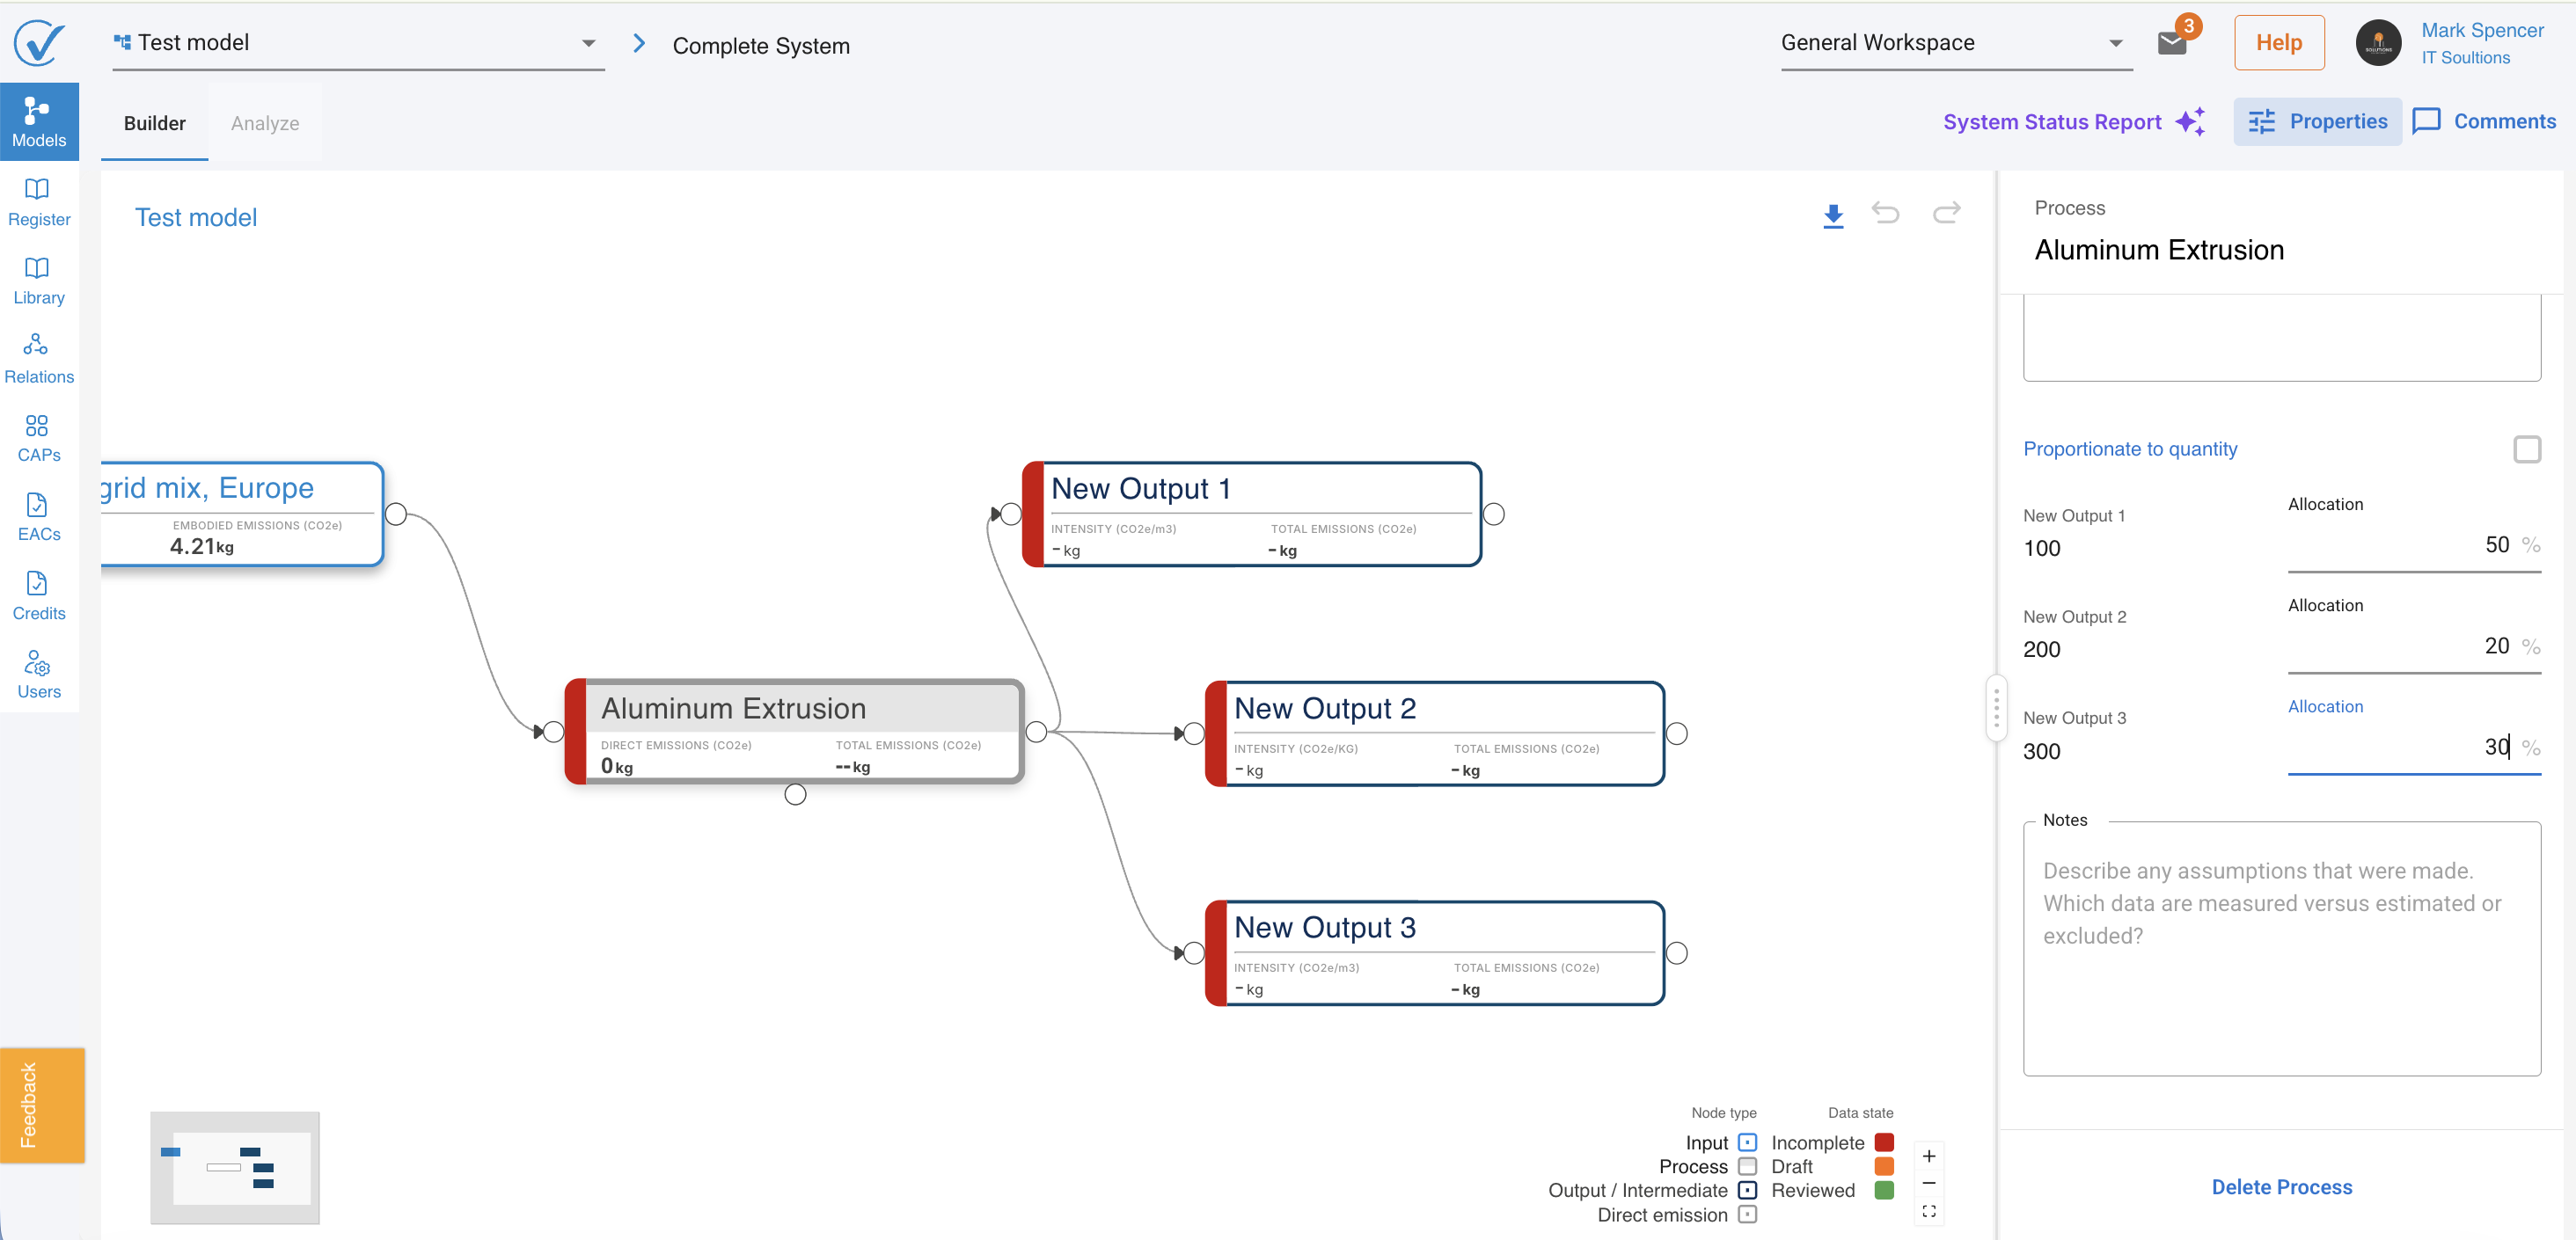
Why allocation matters: When one process creates multiple outputs, you need to specify how much of the total emissions should be attributed to each output. This ensures accurate carbon footprinting for each product.
Output fields
Required:
- Title (output name)
- Quantity (amount produced)
- Unit (measurement unit)
Optional:
- Notes
- Document uploads
Intermediate outputs (connecting to another process)
When an output connects to another process as an input:
- The output becomes an intermediate node
- Connection lines show as dashed until data is complete
- Process node turns red if it was orange (missing data in chain)
- New field appears in output sidebar: "as an input to"
What to do: Enter the quantity available to the downstream process.
What you see: Once data is complete, the connection line turns solid and both processes show updated calculations.
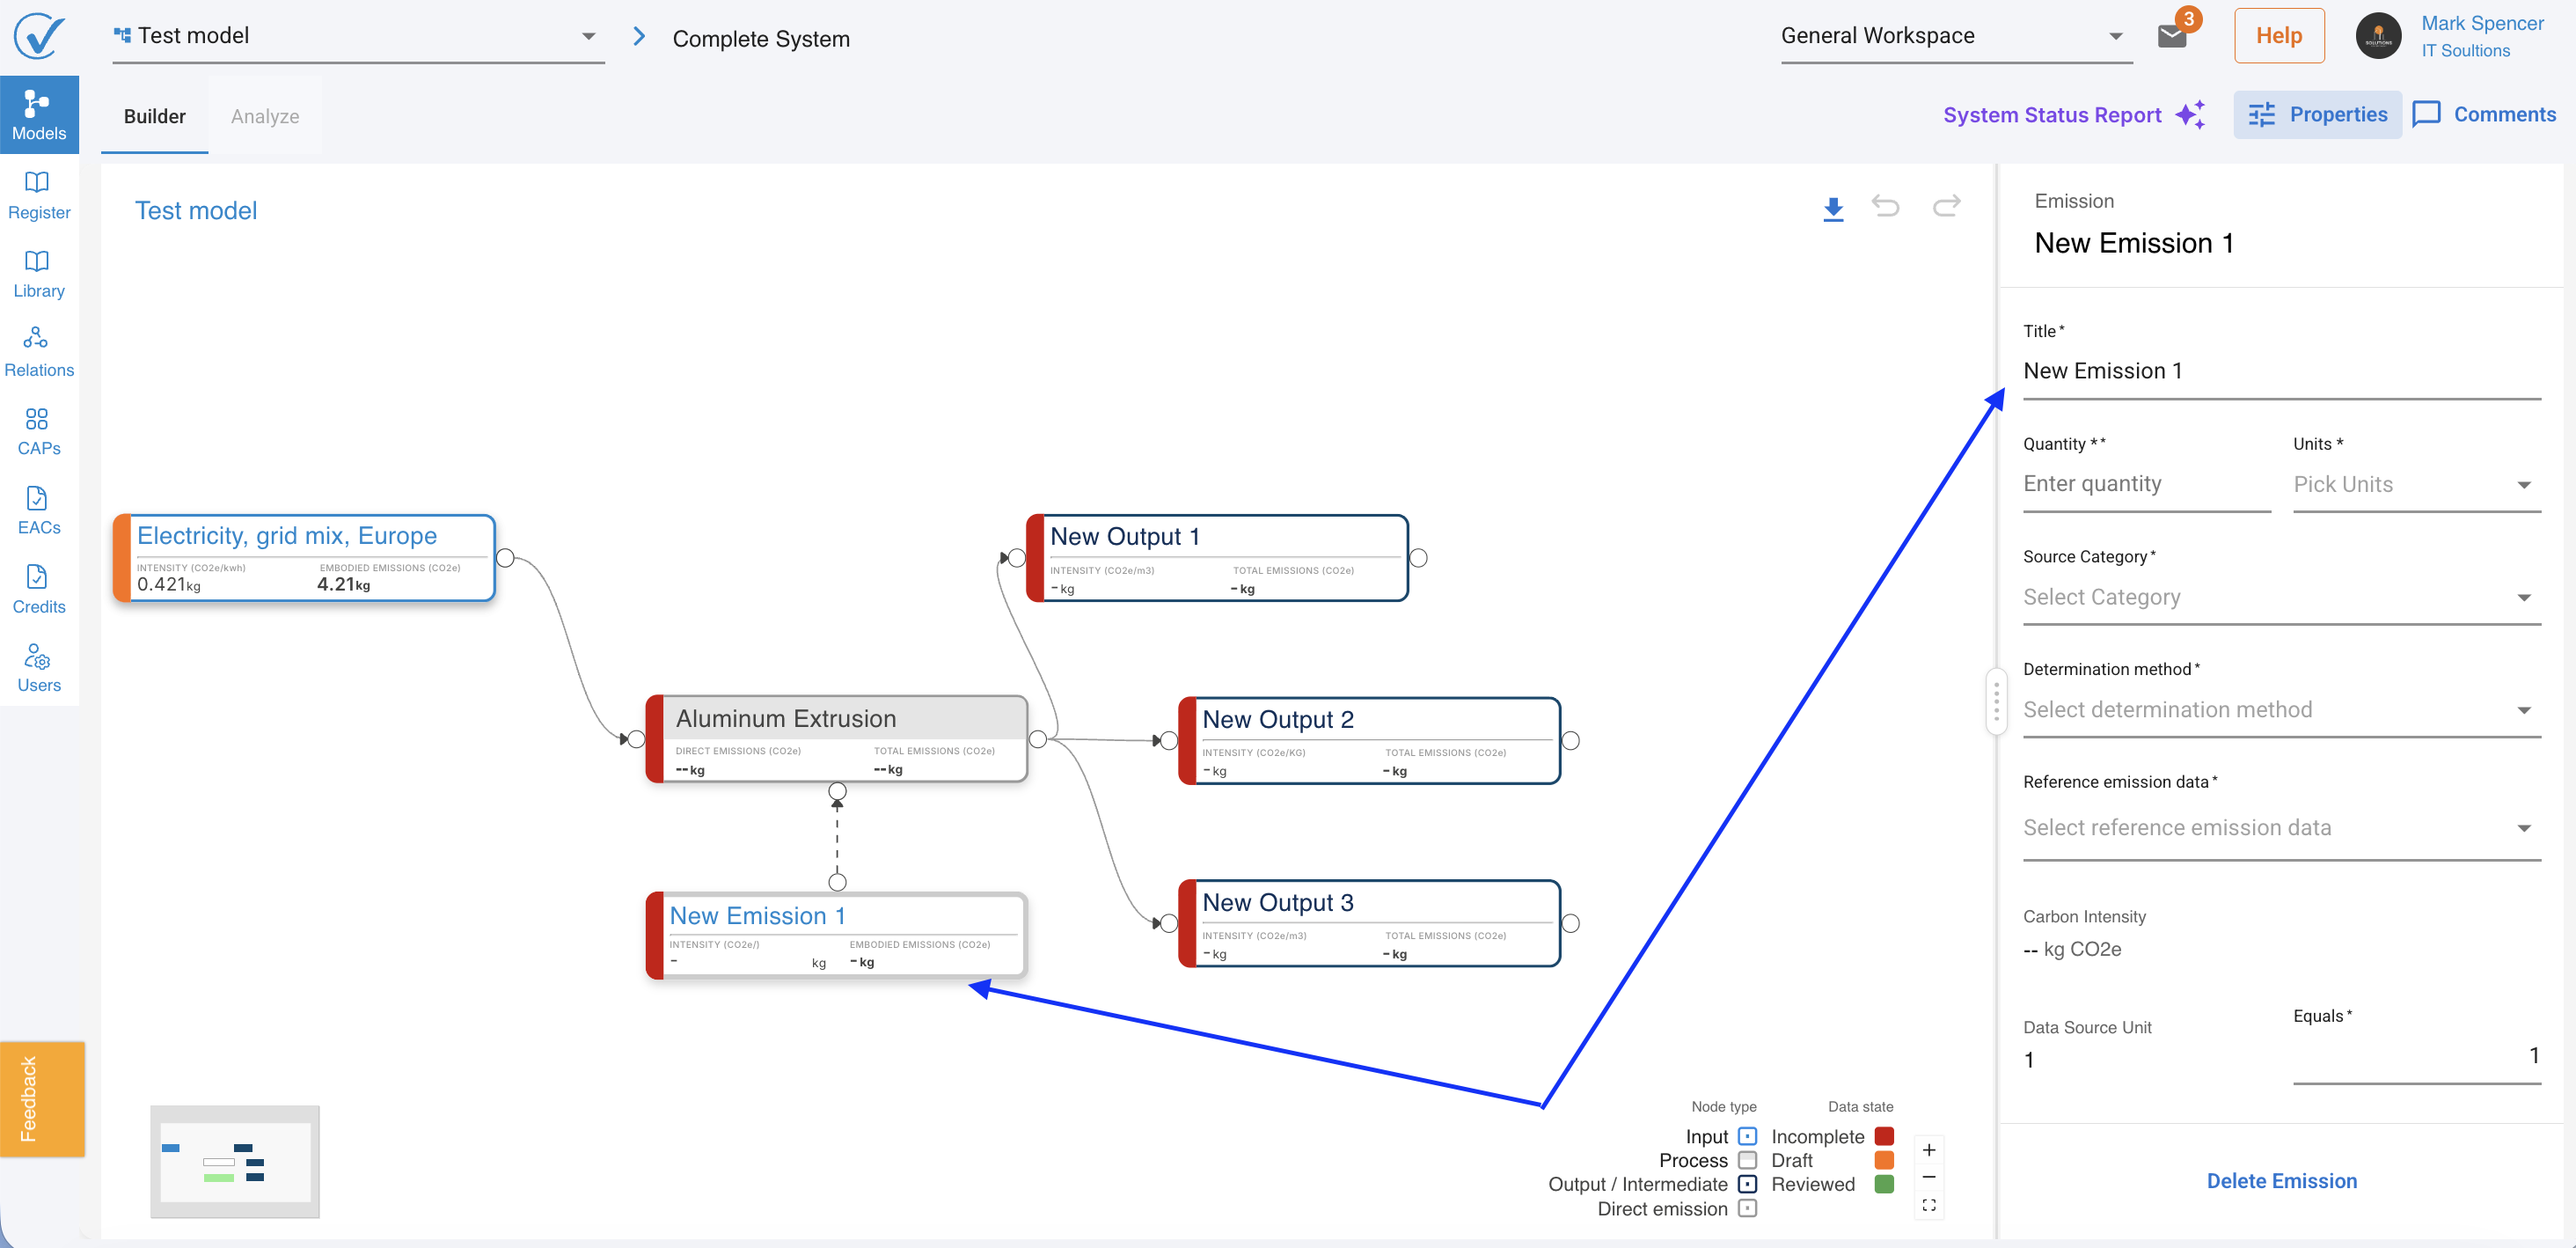
Step 4: Add direct emissions (Scope 1)
Direct emissions are emissions your organization creates directly, such as fuel combustion, industrial processes, or on-site activities.
- Right-click on your process
- Select Add Emission
What you see: A new direct emission node appears with default name "New Emission" and the right sidebar opens with emission fields. This automatically categorizes as Scope 1.
When you add a direct emission node without data, you'll notice:
- All downstream nodes turn red
- Process node cannot calculate complete emissions
- Outputs show incomplete calculations
Why this happens: Process nodes need ALL input data (inputs plus direct emissions) to calculate outputs accurately. The missing direct emission data creates a gap in calculations.
What to do: Add emission data to the direct emission node. Once complete, downstream nodes return to orange status.
Direct emission fields
Required:
- Title (emission source name)
- Quantity (amount of fuel/activity)
- Unit (measurement unit)
- Source Category
- Determination Method
- Reference Emission data (kg CO2e per unit)
- Conversion factor
Optional:
- Notes
- Document uploads
Calculated automatically:
- Converted Carbon Intensity (kg CO2e/unit)
- Total direct emissions (kg CO2e)
Examples of direct emissions
- Diesel fuel combustion in company vehicles
- Natural gas used in on-site boilers
- Refrigerant leakage from cooling systems
- Chemical reactions in manufacturing processes
Step 5: Build complex systems (optional)
For multi-stage processes, you can create chains of connected processes:
- Add multiple processes to canvas
- Connect them by adding outputs from one process as inputs to another
- Create process chains: Raw Material → Processing → Assembly → Final Product
Best practices for complex systems:
- Build structure first (all processes and connections)
- Then add data to each node systematically
- Use status colors to track completion
- Verify allocation percentages for multi-output processes
Complete all nodes before analyzing
Follow this workflow for best results:
Recommended workflow
- Add structure first: Create all processes, inputs, outputs, and direct emissions
- Complete red nodes: Add required data to all red nodes (they turn orange)
- Review orange nodes: Check calculations, then toggle review button ON (they turn green)
- Verify connections: Ensure solid lines (not dashed) between all nodes
- Activate Analyze tab: Once all required data is complete, Analyze becomes active
Progress indicators
Connection lines:
- Dashed lines = Node is red (incomplete data)
- Solid lines = Node is orange or green (has data)
Node colors:
- Red = Missing required data
- Orange = Data complete, needs review
- Green = Reviewed and approved
Green nodes are optional: You can analyze system models with orange nodes. Green status is for quality assurance and team confidence, not a requirement for calculations.
Review toggle button
Every node sidebar includes a review toggle at the bottom. This controls whether nodes are orange (needs review) or green (approved).
Button states
State | Appearance | What it means | What to do |
| Disabled | Greyed out, cannot toggle | Some required data is missing | Complete all mandatory fields first |
| Enabled | Can be toggled | All data complete, ready for review | Review information then toggle ON |
| Toggled ON | Button is blue | You confirmed data is accurate | Node turns green |
How to review data
Step by step:
- Enter all required data (emission source, quantity, conversion factor, etc.)
- Review the automatic calculations:
- Emission intensity (kg CO2e per unit)
- Total emissions (kg CO2e)
- Scope designation
- Check for accuracy:
- Do the numbers look reasonable?
- Is the emission source appropriate?
- Are units correct?
- Toggle the "Review" button to ON
- Node changes from orange to green
What you see:
- Node changes from orange to green
- Visual indicator confirms approval
- Node ready for verified analysis
When nodes require re-review
Nodes automatically revert to orange (needs review) when you make any edits:
- Change quantity
- Modify conversion factor
- Switch emission source
- Update any field
Why this happens: Any modification could affect carbon calculations. Model requires you to re-verify after changes to ensure data quality and prevent errors.
What to do:
- Make your edits
- Review updated calculations
- Toggle review button ON again
- Node returns to green
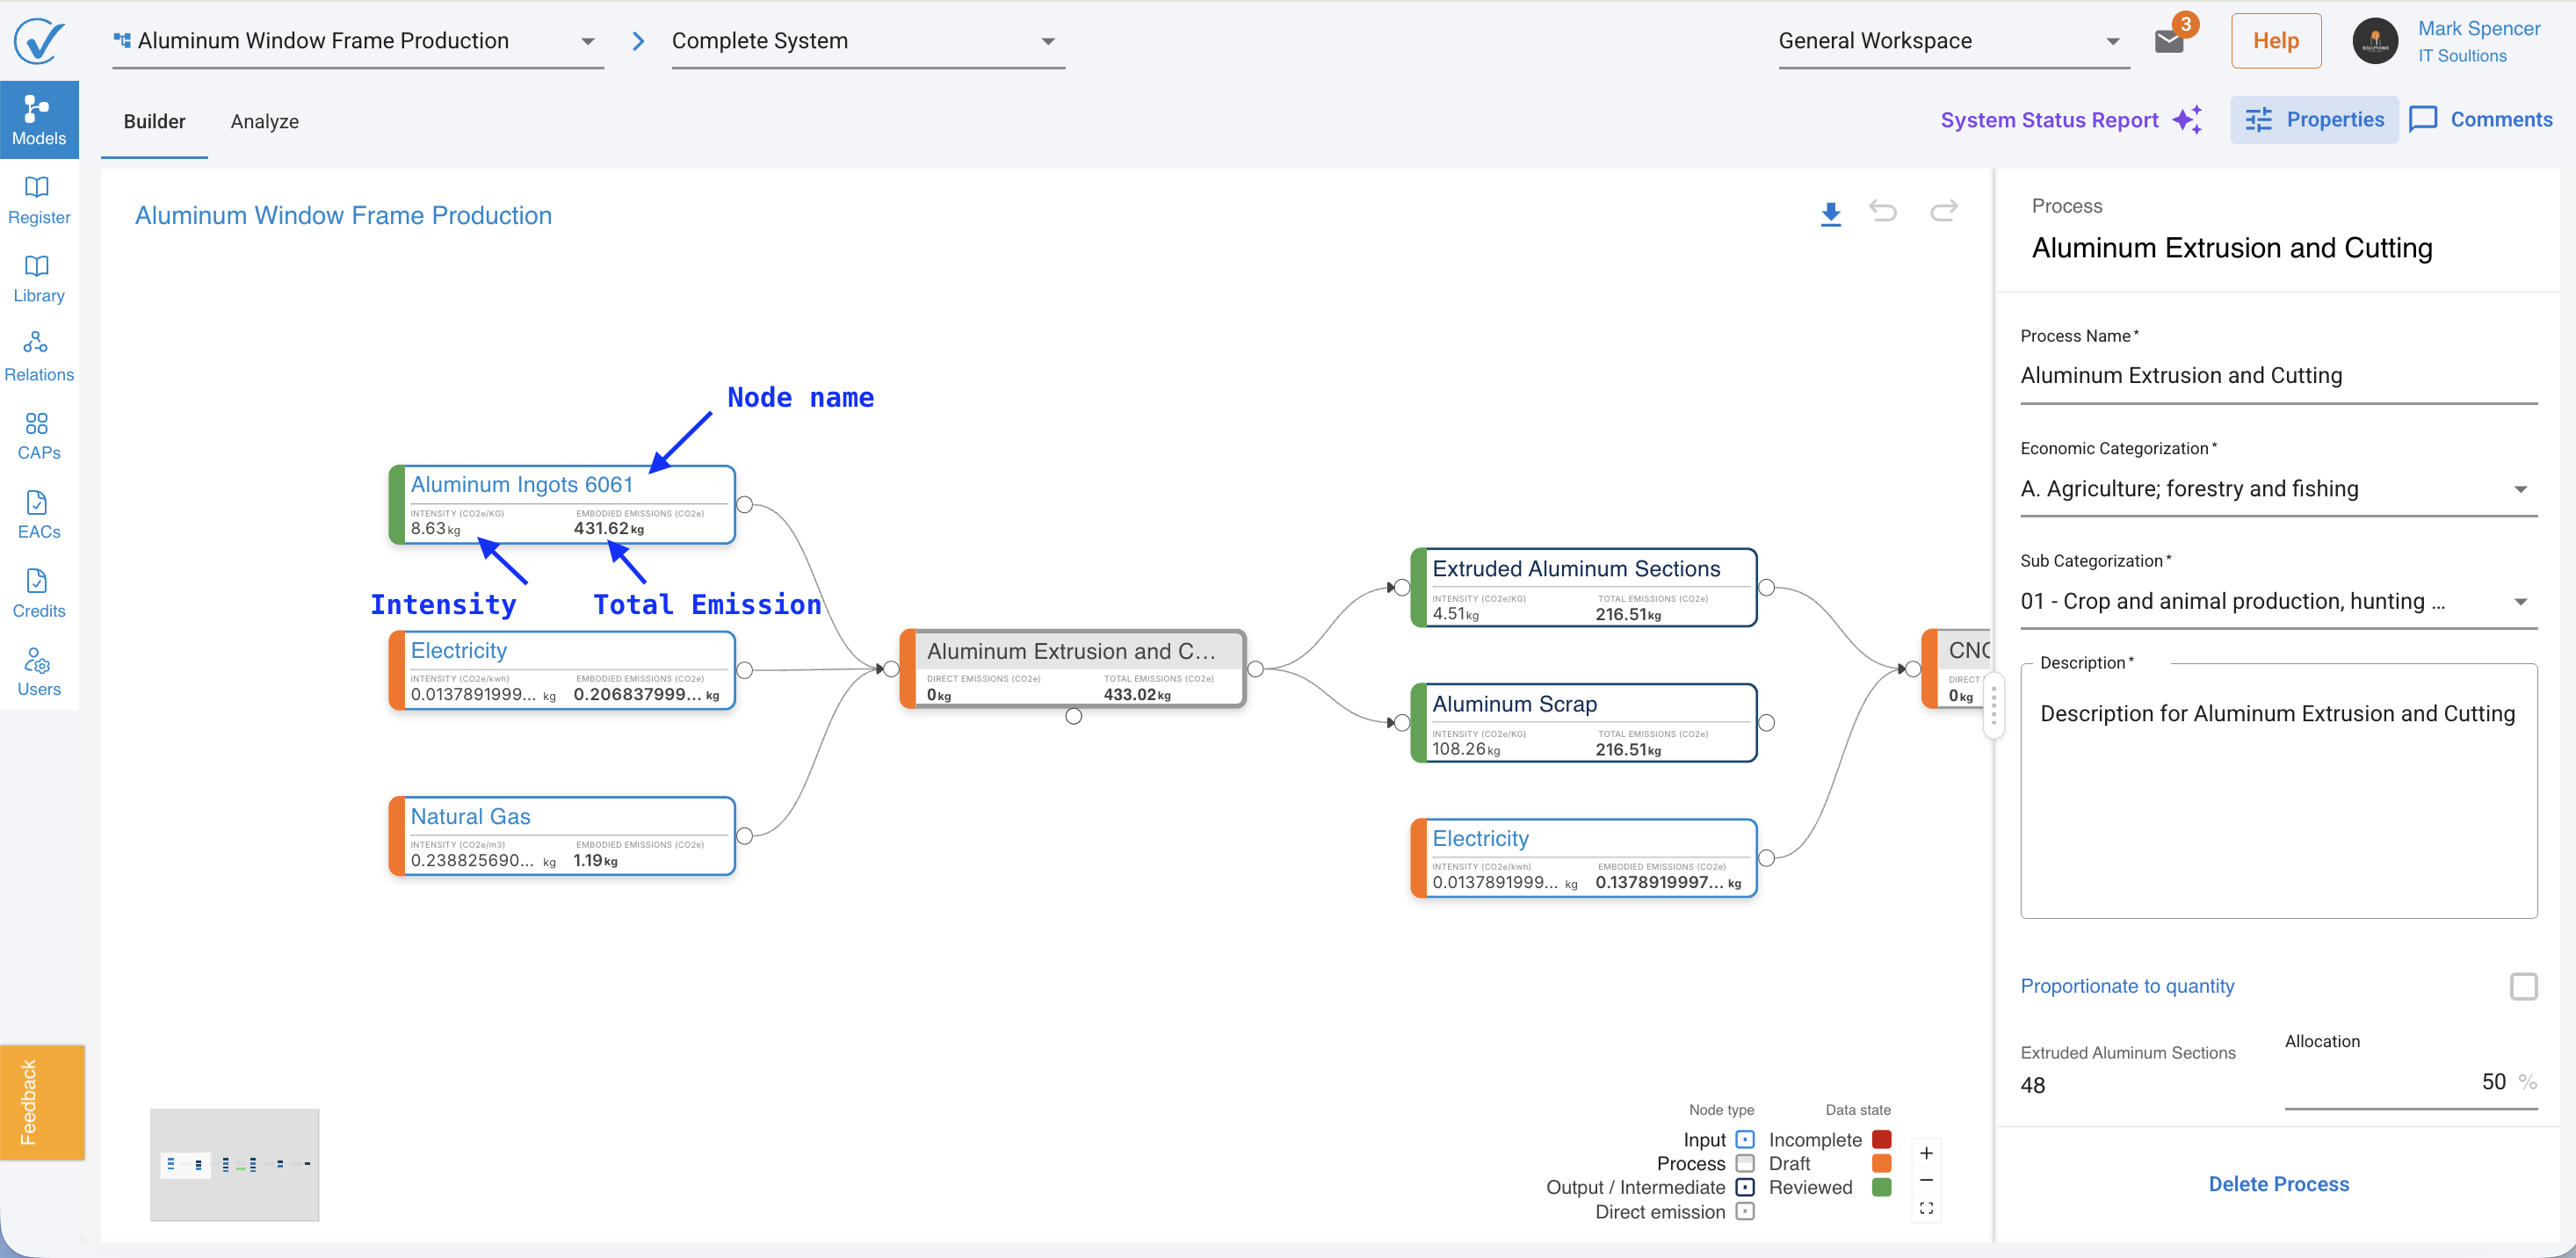
Node information display
Each node shows key emission information directly on the canvas without clicking to open.
Input, Direct Emission, and Output nodes display
Three lines of information:
- Node name (e.g., "Aluminum Ingots 6061")
- Intensity (value plus unit) → e.g., "8.62 kg CO2e/kg"
- Total Emissions (value plus unit) → e.g., "431.20 kg CO2e"
Process nodes display
Three lines of information:
- Node name (e.g., "Aluminum Extrusion and Cutting")
- Total Direct Emissions (value plus unit) → e.g., "0 kg CO2e"
- Sum of Scope 1, 2, and 3 emissions (value plus unit) → e.g., "432.46 kg CO2e"
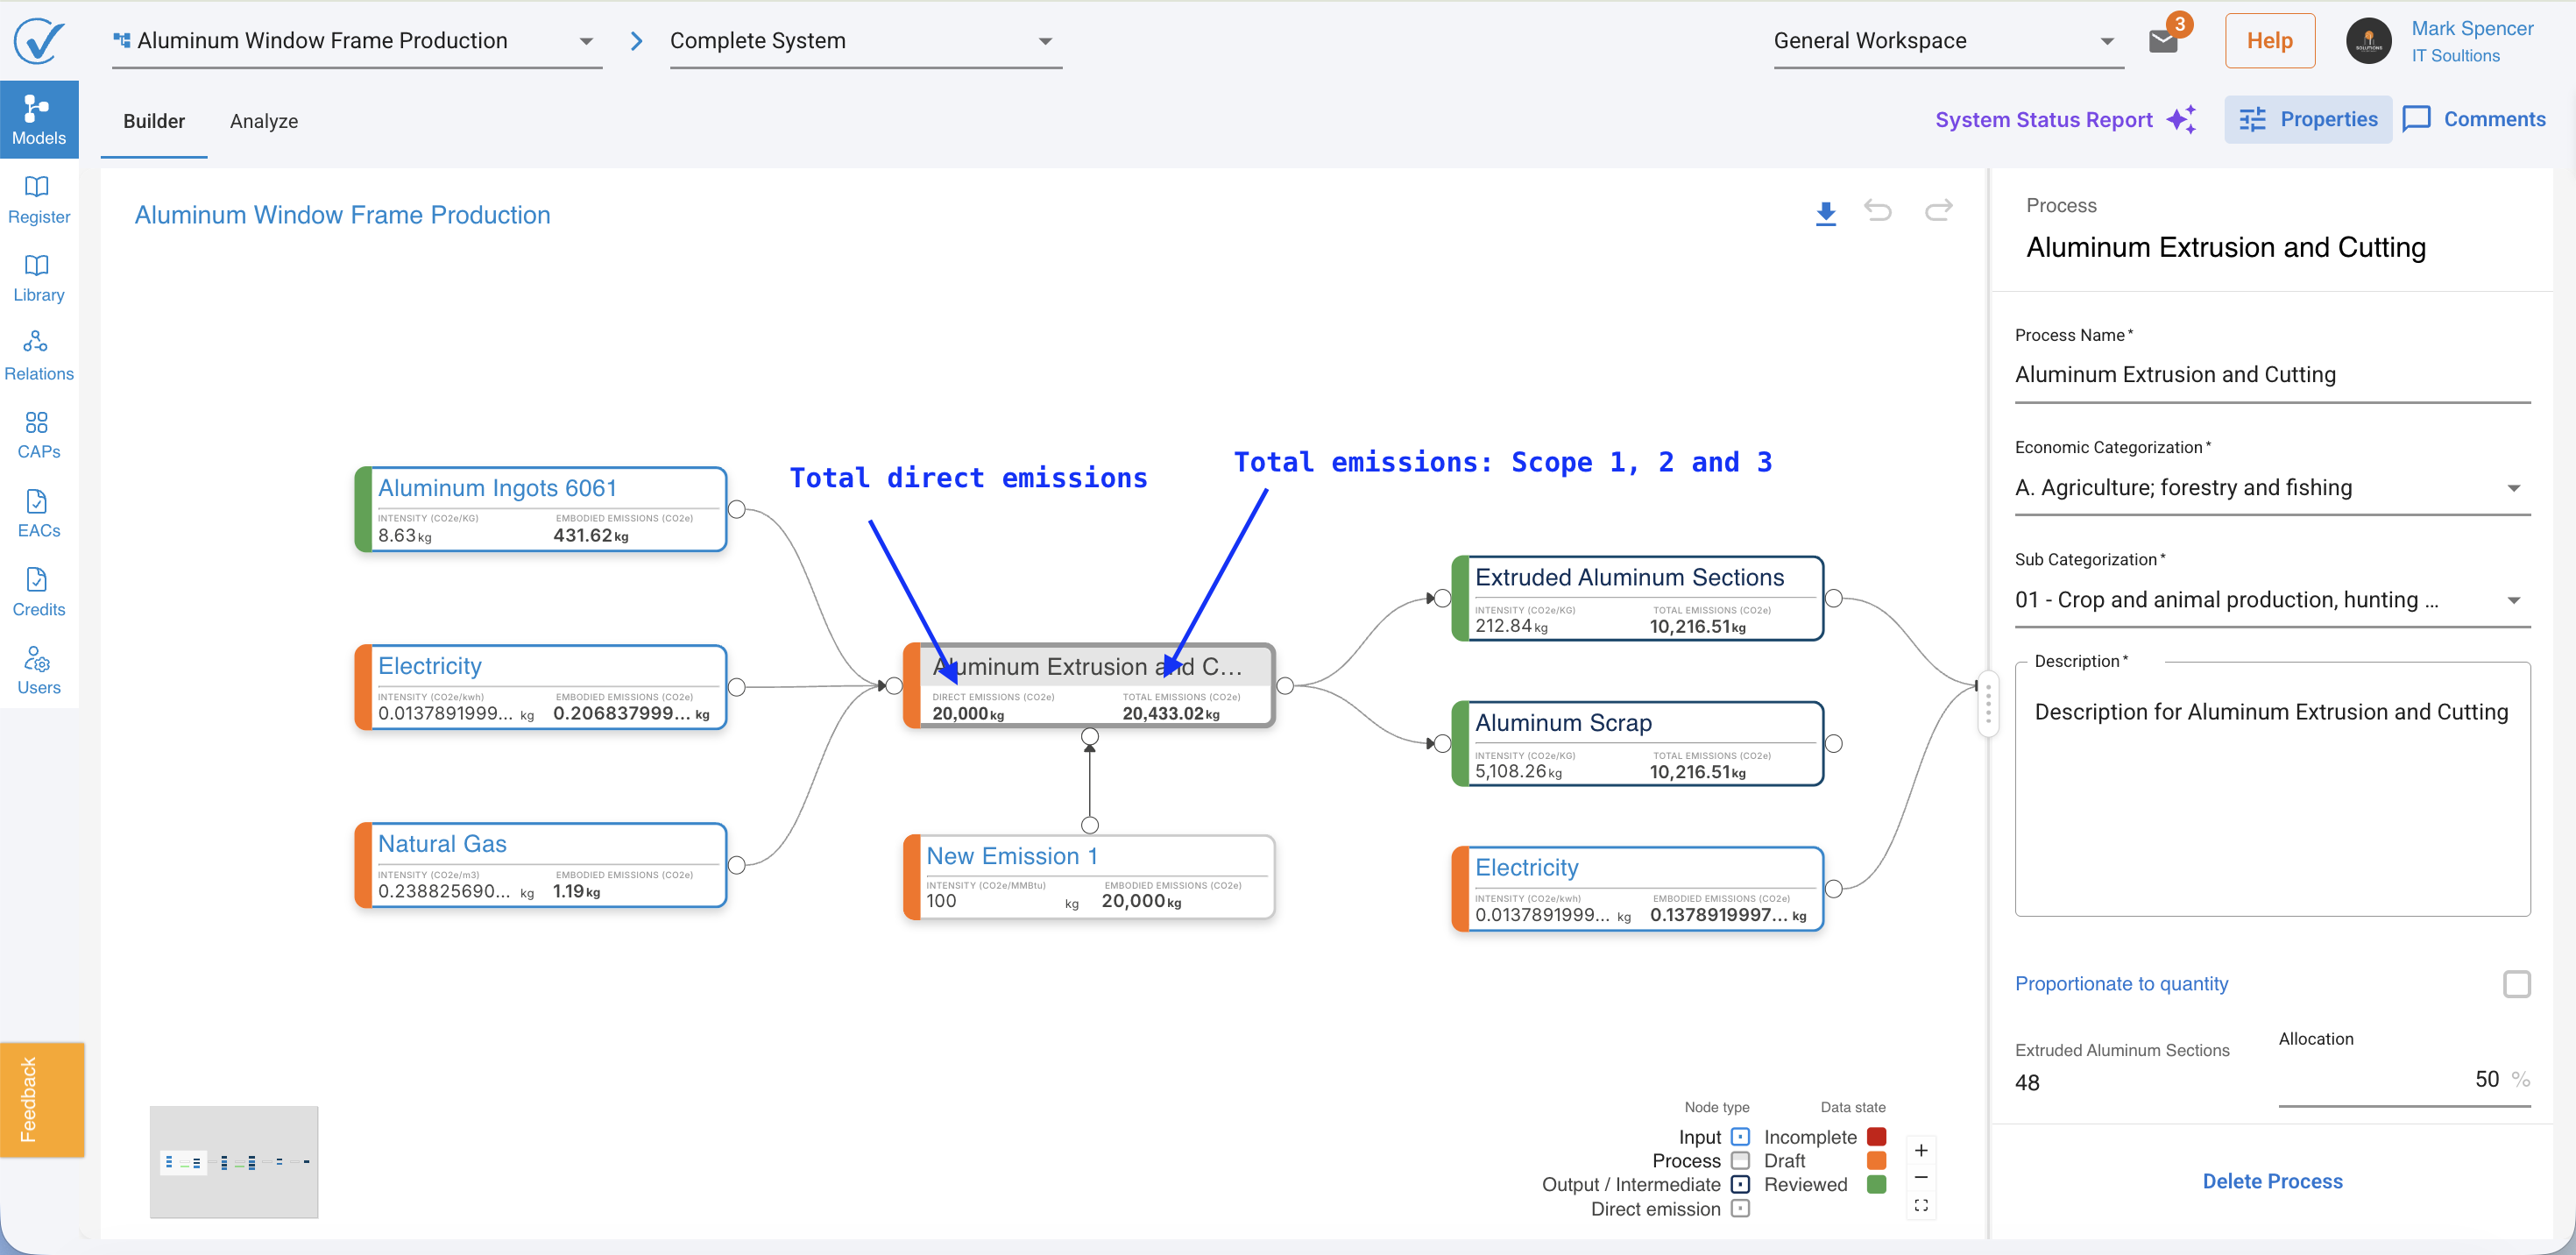
If data is missing from connected nodes, you'll see "--" instead of values.
Benefits
- Instant overview: See emission values without opening nodes
- Quick comparisons: Compare intensities across similar inputs
- Faster validation: Spot anomalies or errors at a glance
- Better context: Understand emission flows while building
When information appears
- Red nodes show structure only (no data yet)
- Orange nodes show calculated values (unreviewed)
- Green nodes show verified values (reviewed)
Connection lines explained
Connection lines between nodes communicate data completion status:
In Builder:
- Dashed lines = Node is red (incomplete data)
- Solid lines = Node is orange or green (has data)
What this means:
- Focus on completing nodes with dashed connections first
- Solid connections indicate calculations are working
- All lines should be solid before activating Analyze tab
Visual hierarchy:
- Node color = data status (red/orange/green)
- Connection lines = data completeness (dashed/solid)
Manage your design
Edit a node
- Click on any node
- Right sidebar opens with current data
- Update fields as needed
- Changes save automatically
Edit system properties
- Click the Properties button in the toolbar or anywhere on canvas
- Right sidebar opens showing system information
- Edit mode name, description, allocation rules, methodology…
- Save changes
Delete elements
To delete a node:
- Delete button is at the bottom of every node
⚠️ Warning: Deleting a process also deletes all its connected inputs, outputs, and direct emissions.
Undo and redo
- Undo/redo buttons available in the toolbar
- Buttons disabled when a node's right sidebar is active
- Session saved while you work in Builder
Quick actions
I want to... | Do this... |
| Add another process | Right-click canvas → Add Process |
| Connect emission sources | Right-click process → Add Input |
| Define outputs | Right-click process → Add Output |
| Add direct emissions | Right-click process → Add Emission |
| Remove something | Right-click element → Delete |
| Edit node data | Click on node |
| Edit system properties | Click Properties button |
| Undo last action | Click Undo button (when sidebar closed) |
Troubleshooting
Lines stay dashed after entering data
Try this:
- Refresh the page
- Verify all required fields completed in the node
- Check for error messages in the sidebar
- Ensure conversion factor is populated
Cannot find the right emission factor
Try this:
- Use AI suggestion feature (click "Suggest LCI with AI")
- Check spelling in search
- Browse by category instead of searching
- Contact support for custom factors: support@carbonsig.com
Calculation seems wrong
Check these:
- Verify conversion factor is correct
- Check quantity units match emission factor units
- Review selected LCI details for appropriateness
- Ensure allocation percentages total 100% (for multi-output processes)
Analyze tab stays inactive
Common causes:
- Missing required fields in one or more nodes
- No output connected to your process
- Connection chain incomplete (dashed lines remain)
- Direct emission added but no data entered
Solution: Look for red nodes and dashed lines. Complete all required data.
Node turned from orange back to red
This happens when:
- You added a direct emission node without data
- You added new output
- You deleted data from a connected node
- A connected input or output became incomplete
Solution: Complete the missing data in the node that turned red or in its connected nodes.
What's next?
Your system structure is complete with data. Now:
- Switch to Analyze tab → Review your calculations and carbon footprint results
- Generate reports → Create system status reports to identify gaps
- Create CAPs → Generate Carbon Attested Products from completed systems
Related: Analyze your system | System Status Indicators | AI-Suggested Emission Data
Last updated: April 2026