
Latest updates May '25
🤖 AI-Powered Carbon Estimation in Titles
Transform how you visualize system impact at a glance! When building systems with AI, you can now display estimated carbon footprint values directly in your system titles for quick reference and comparison.
Key Benefits:
- Instant Overview: See carbon estimates without diving into detailed reports
- Quick Comparisons: Compare multiple system scenarios at a glance
- Enhanced Workflow: Streamline your decision-making process
- Optional Feature: Choose when you want this information displayed
📊 Enhanced Bar Chart Hover Insights
Get deeper insights instantly! Our improved hover tooltips now show detailed scope breakdowns (Scope 1, 2, and 3) with percentages, giving you the complete picture of your carbon footprint composition.
Key Benefits:
- Detailed Scope Analysis: See exact breakdown of Scope 1, 2, and 3 emissions
- Percentage Insights: Understand the relative contribution of each scope
- Consistent Experience: Same detailed view across all input types
- Faster Analysis: No need to switch between different views for scope details
🚀 Ready to Explore?
These features are live now in your CarbonSig account. Check out our detailed help guide below to learn how to make the most of these new capabilities.
AI-Powered Carbon Estimation in Titles
Overview
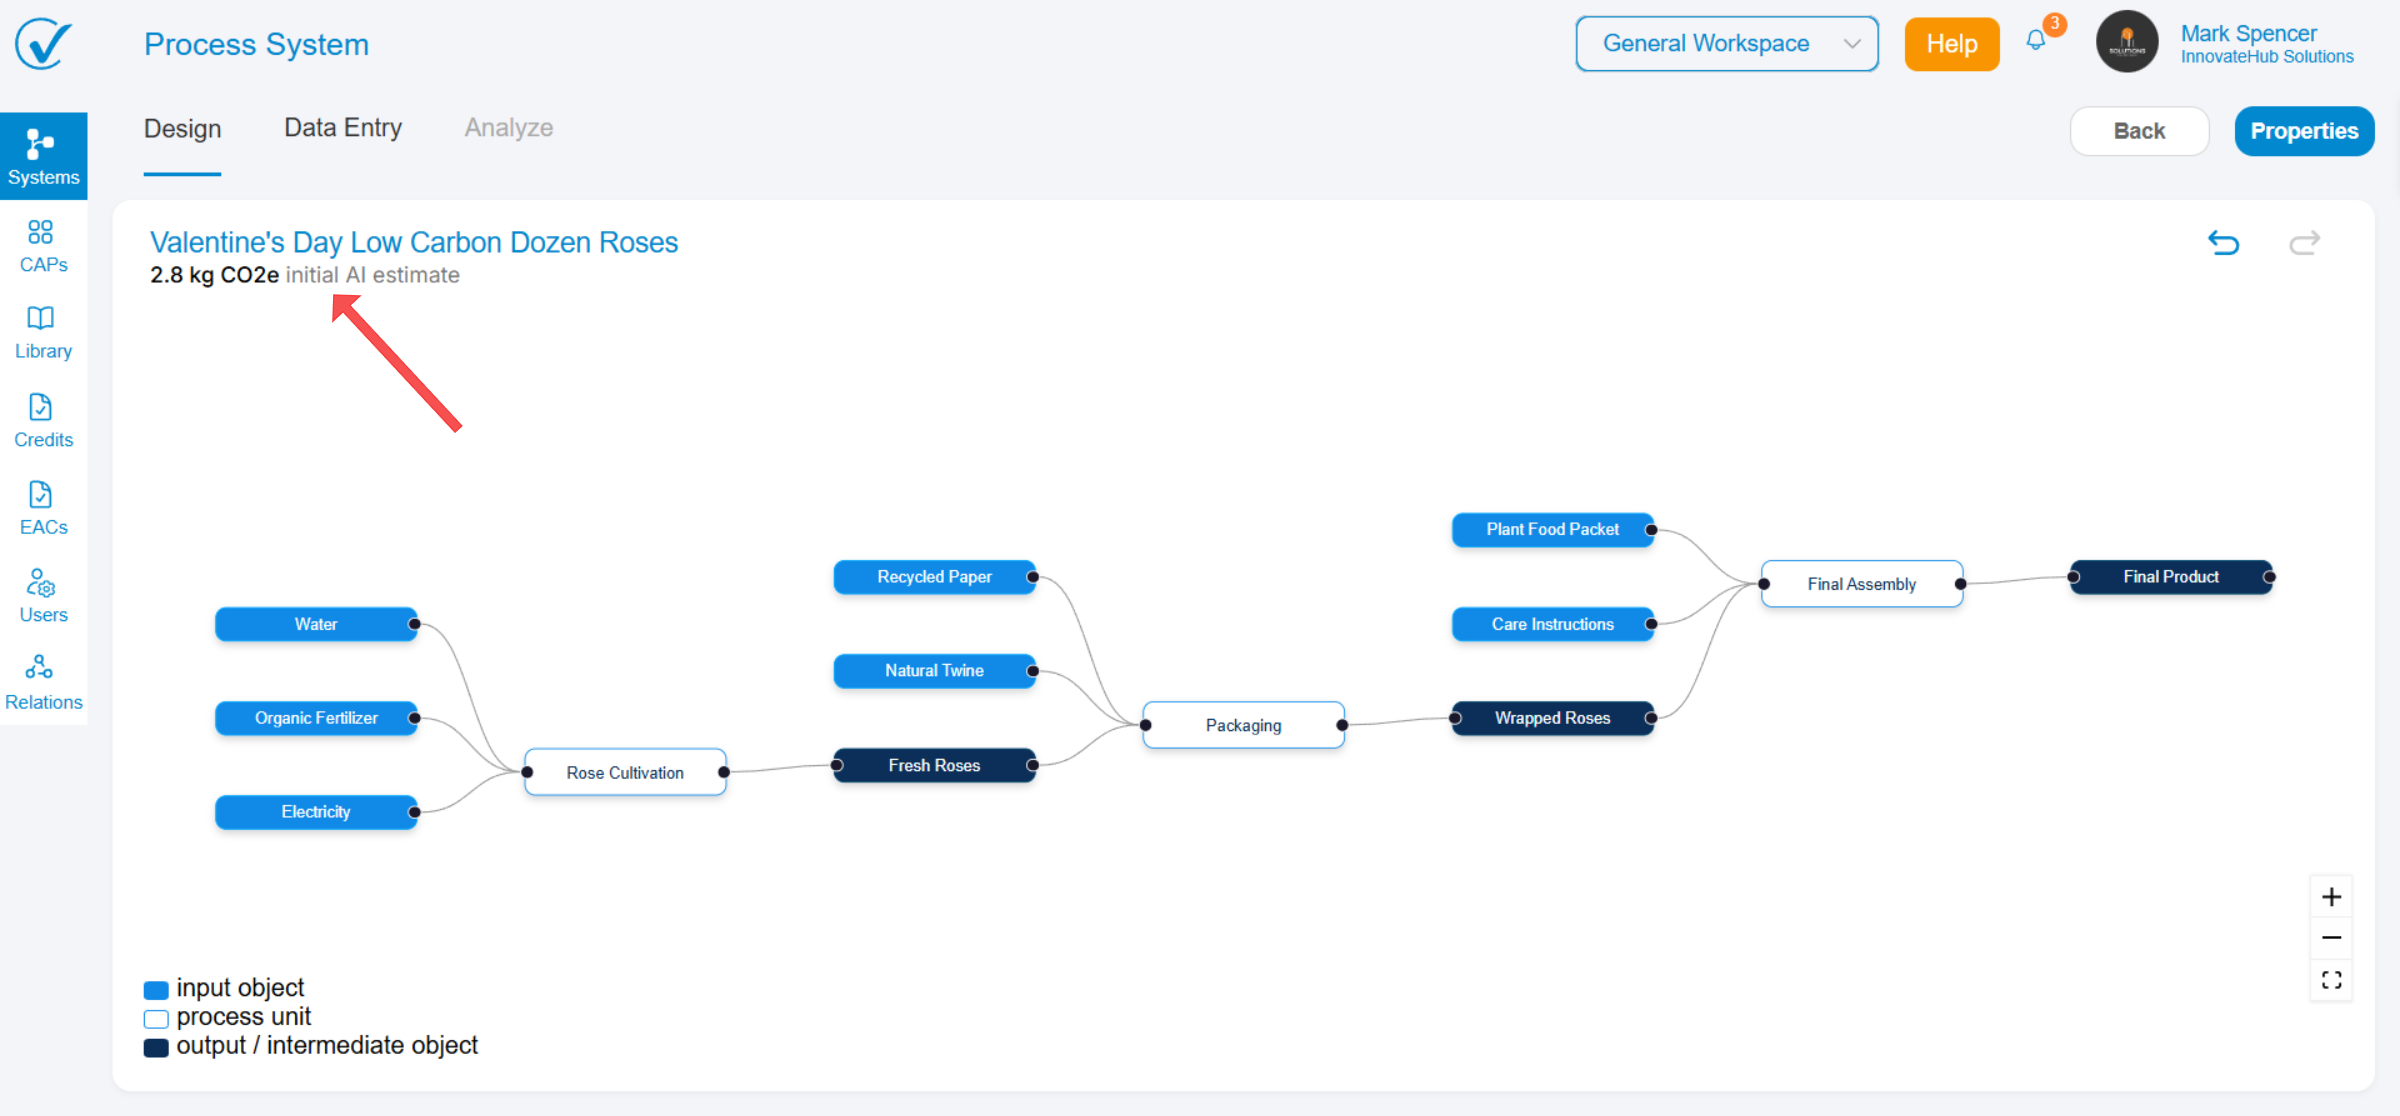
The AI estimation feature allows you to display estimated carbon footprint values directly in your system titles when using the AI Builder. This provides quick visual reference for carbon impact without needing to access detailed reports.
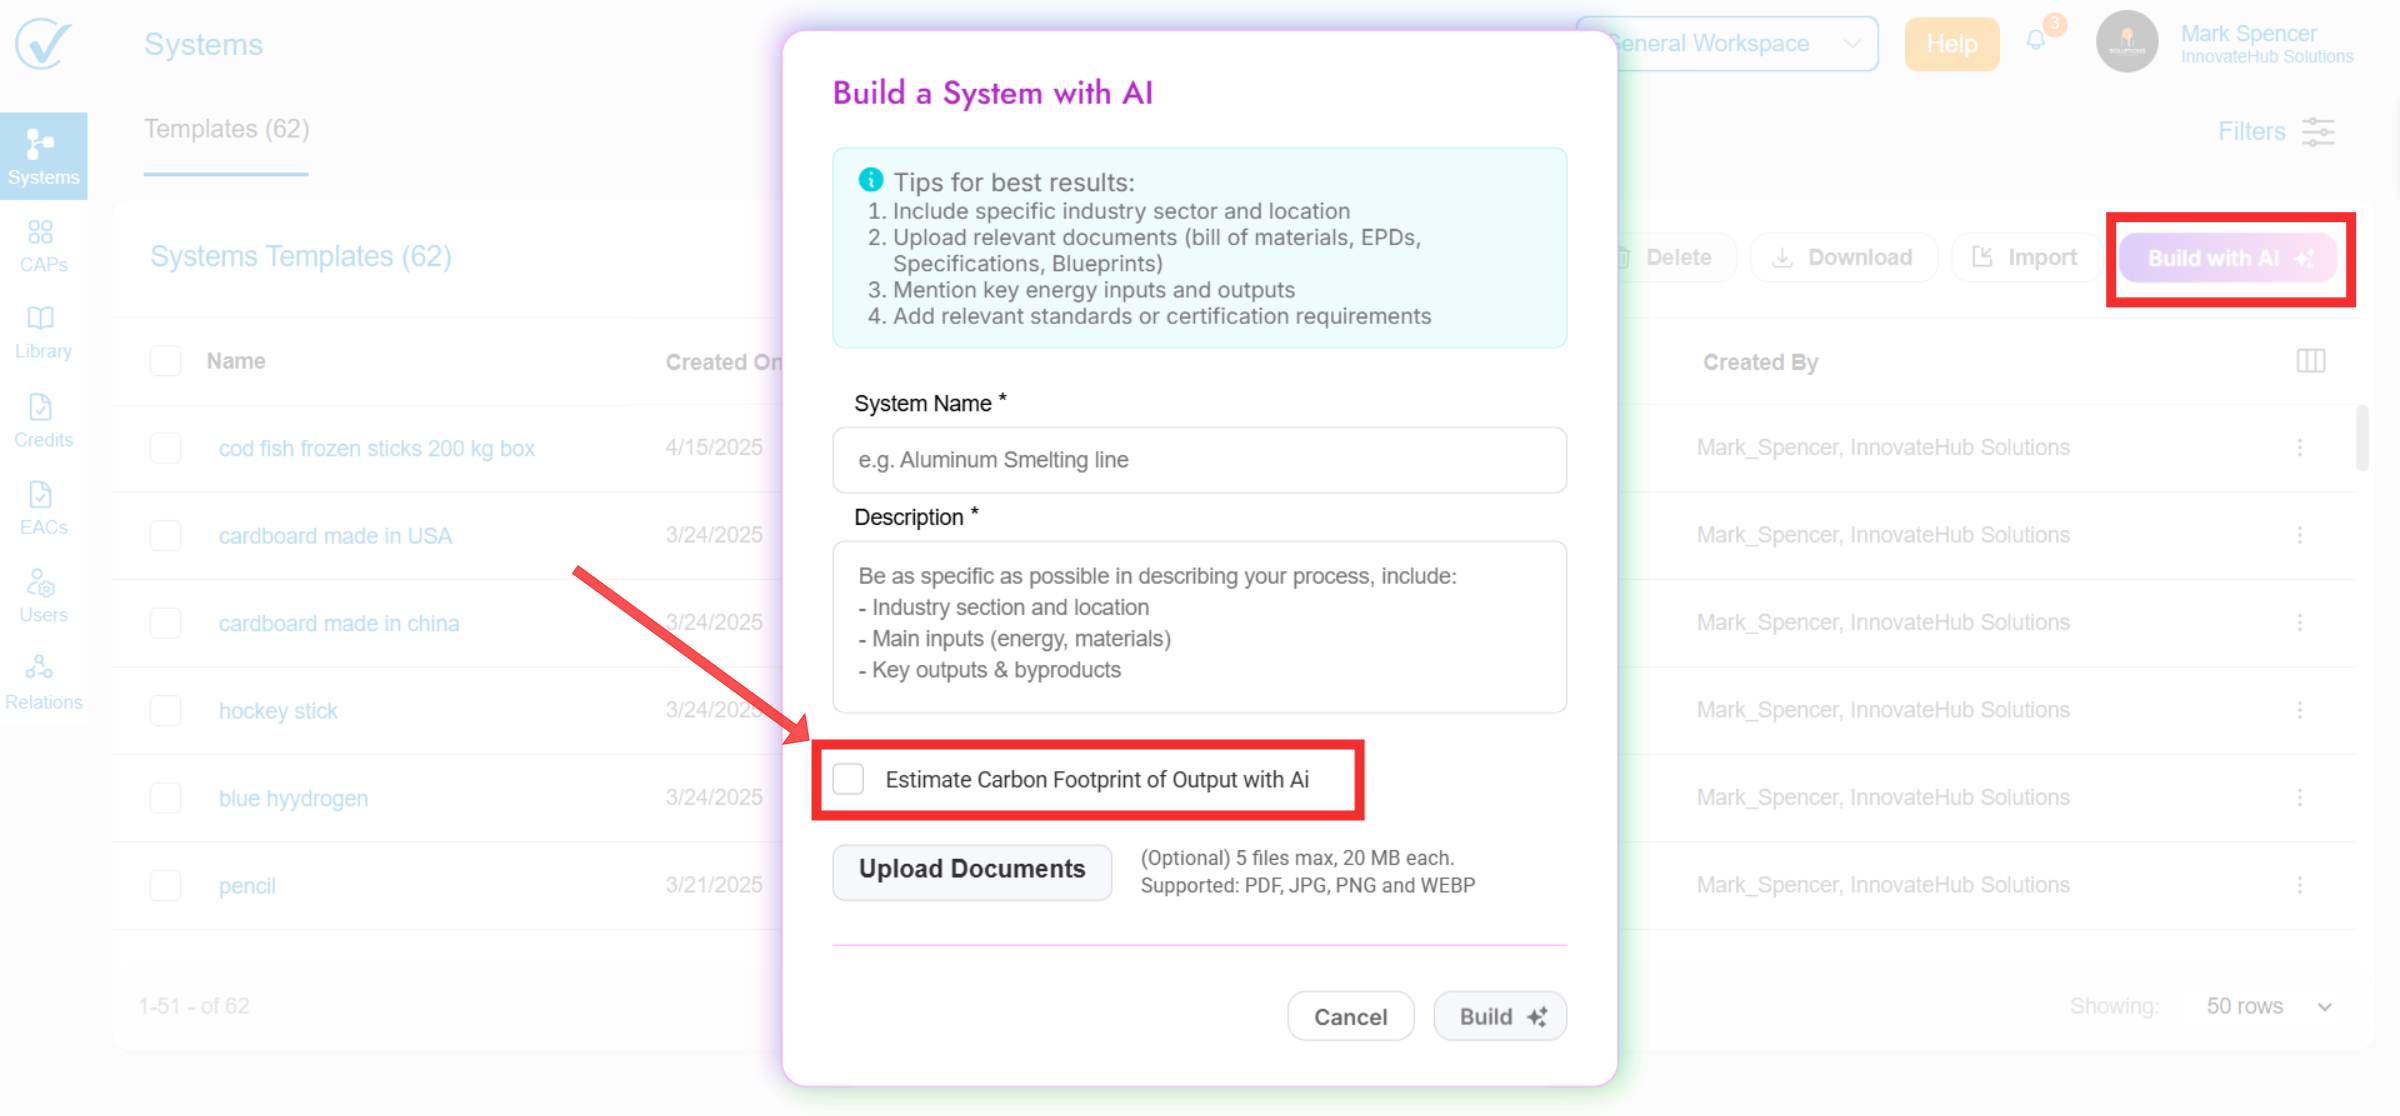
How to Enable AI Estimation
- Start Building with AI
- Navigate to your system builder
- Select the option to "Build with AI"
- Enable Carbon Estimation
- In the AI Builder modal, look for the new checkbox labeled: "Show estimated carbon footprint in title (for estimation purposes only)"
- ✅ Check this box to enable the feature
- ❌ Leave unchecked if you prefer not to display estimates in titles
- Complete Your System Build
- Continue with your normal AI building process
- The system will generate with carbon estimates displayed in the title area
What You'll See
- Title Display: Carbon footprint estimates appear prominently in your system title
- Estimation Clarity: Values are clearly marked as estimates for reference purposes
- Updated Design: New layout with legend positioned at the bottom for better visibility
Best Practices
- Use for Comparison: Enable this feature when comparing multiple system scenarios
- Quick Reference: Ideal for dashboard overviews and high-level presentations
- Remember: These are estimates - refer to detailed analysis for precise calculations
Enhanced Bar Chart Hover Insights
Overview
Our upgraded hover functionality provides detailed scope breakdowns when you hover over elements in bar charts, giving you instant access to Scope 1, 2, and 3 emission data with percentages.
How to Use Enhanced Tooltips
- Navigate to Bar Chart View
- Open any system with carbon footprint data
- Switch to the "Bar Chart" tab in your analysis view
- Hover for Detailed Information
- Input Sources: Hover over any input bar to see scope breakdown
- Direct Emissions: Hover over emission sources for detailed scope information
- System Components: Hover over linked systems for comprehensive scope data
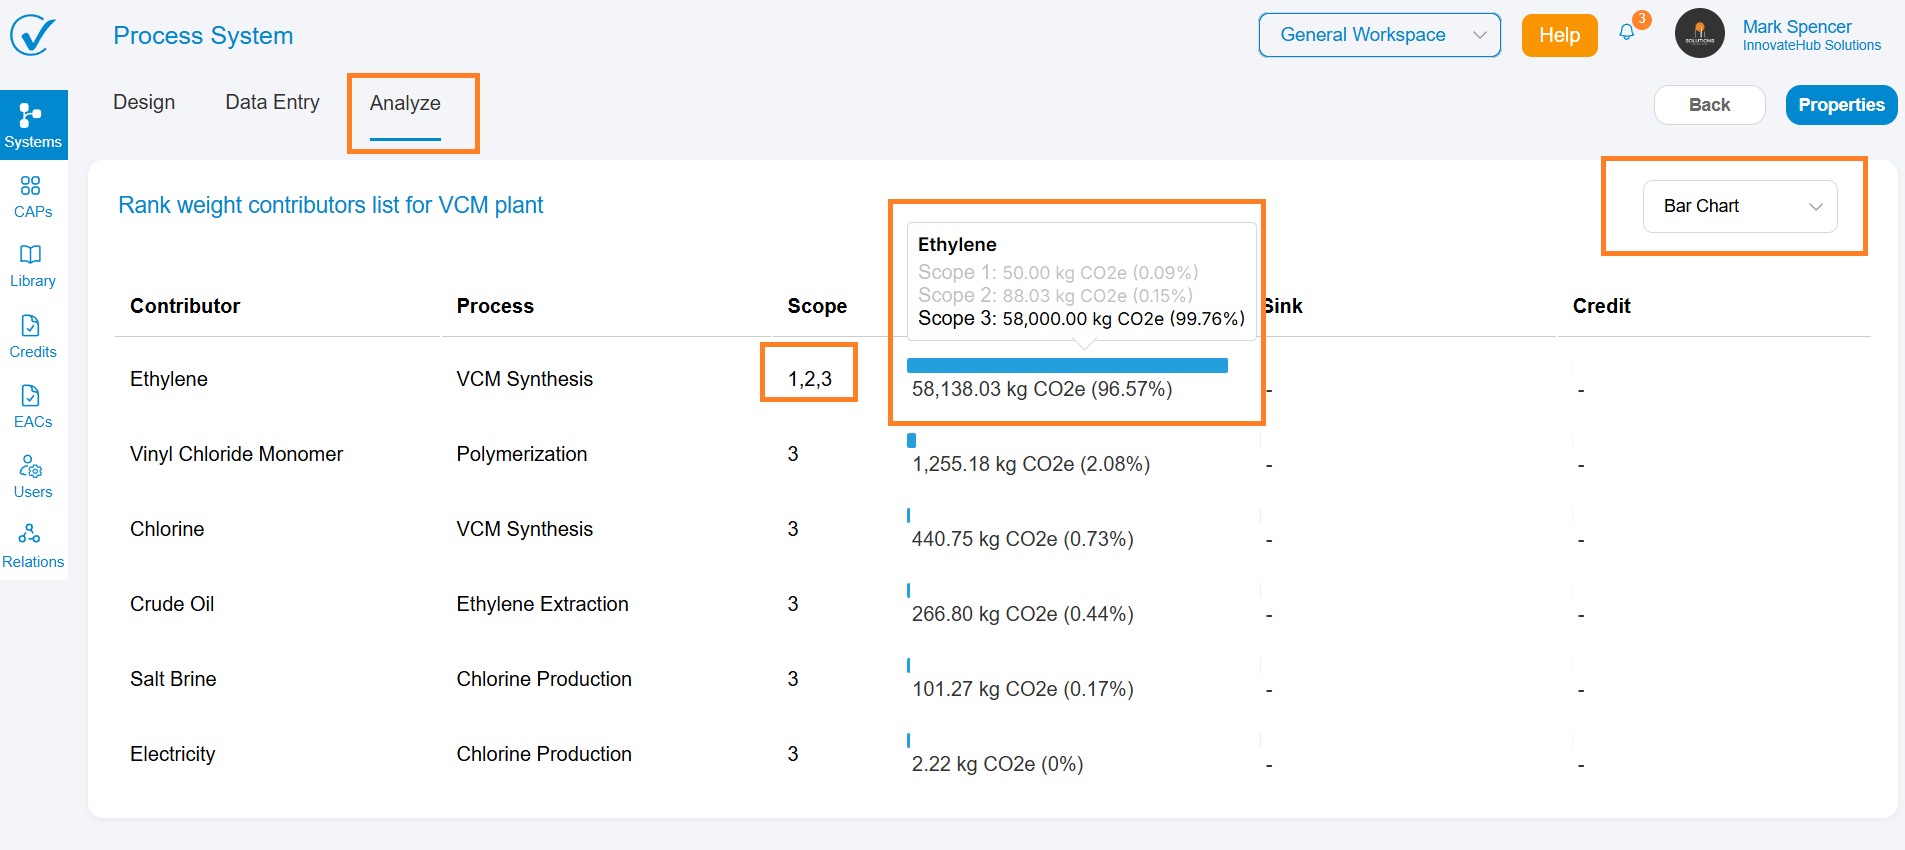
What the Enhanced Tooltips Show
For All Input Types:
- Scope 1 Emissions: Direct emissions with percentage contribution
- Scope 2 Emissions: Indirect energy-related emissions with percentage
- Scope 3 Emissions: Other indirect emissions with percentage
- Total Embodied Emissions: Complete carbon footprint summary
For System Sources:
- Mixed Scope Display: When systems contain multiple scopes
- Individual Scope Contributions: Breakdown of each scope's impact
- Percentage Distribution: Relative contribution of each scope type
Visual Improvements
- Consistent Design: Same tooltip style across all chart elements
- Clear Scope Identification: Color-coded scope information
- Percentage Clarity: Easy-to-read percentage breakdowns
- Professional Layout: Clean, organized information display
Comparison with Previous Version
| Before | After |
|---|---|
| Simple name + total CO2 | Detailed scope breakdown |
| Basic percentage of total | Individual scope percentages |
| Limited insight | Comprehensive emission analysis |
| Generic tooltips | Source-specific information |
🛠️ Troubleshooting
AI Estimation Issues
Problem: Checkbox not appearing in AI Builder
- Solution: Ensure you're using the latest version and refresh your browser
Problem: Estimates not showing in title
- Solution: Verify the checkbox was selected before building the system
Bar Chart Tooltip Issues
Problem: Tooltips not showing scope breakdown
- Solution: Ensure your system has scope data available and try refreshing the chart
Problem: Tooltips appearing behind navigation
- Solution: This has been fixed in the latest update - refresh your browser
💡 Tips for Maximum Benefit
AI Estimation Tips
- Enable for Workshops: Great for collaborative sessions and stakeholder presentations
- Scenario Planning: Use when comparing different system configurations
- Quick Decisions: Helpful for rapid prototyping and initial assessments
Bar Chart Analysis Tips
- Deep Dive Analysis: Use hover data to identify scope hotspots
- Scope Strategy: Focus improvement efforts on highest-percentage scopes
- Data Validation: Cross-reference hover data with detailed reports
- Trend Analysis: Track scope changes across different system versions
Questions? Our support team is here to help you maximize these new features!
These updates are part of our ongoing commitment to making carbon footprint analysis more accessible and actionable for all users.